Free Access
Fig. 6
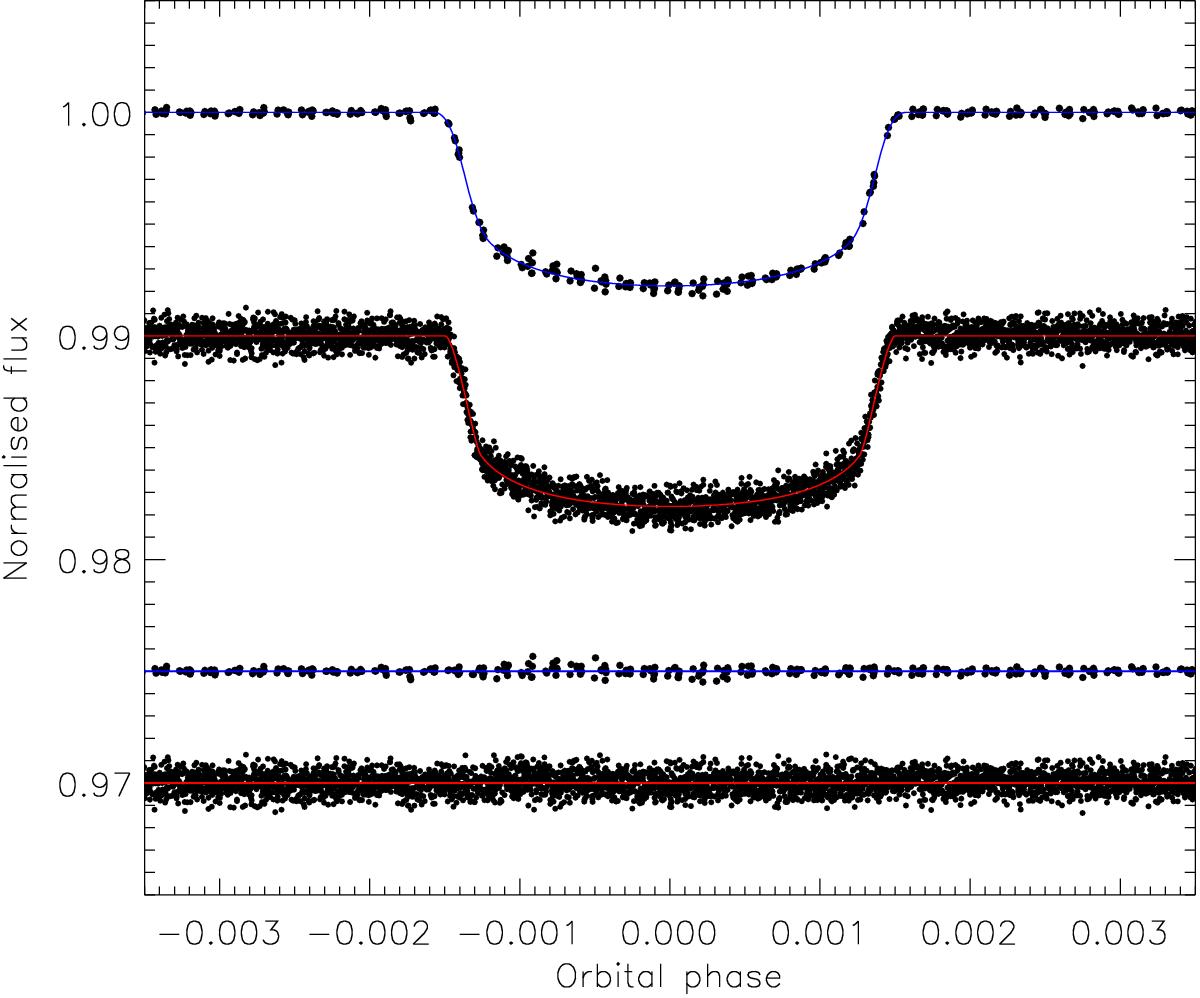
Phased Kepler long-cadence (top light curve) and short-cadence (bottom light curve) data zoomed around transit phase. The TTVs (see Sect. 4) were removed from the data before plotting. The jktebop best fits are shown using solid lines. The residuals of the fits are plotted at the base of the figure.
Current usage metrics show cumulative count of Article Views (full-text article views including HTML views, PDF and ePub downloads, according to the available data) and Abstracts Views on Vision4Press platform.
Data correspond to usage on the plateform after 2015. The current usage metrics is available 48-96 hours after online publication and is updated daily on week days.
Initial download of the metrics may take a while.