Free Access
Fig. 4
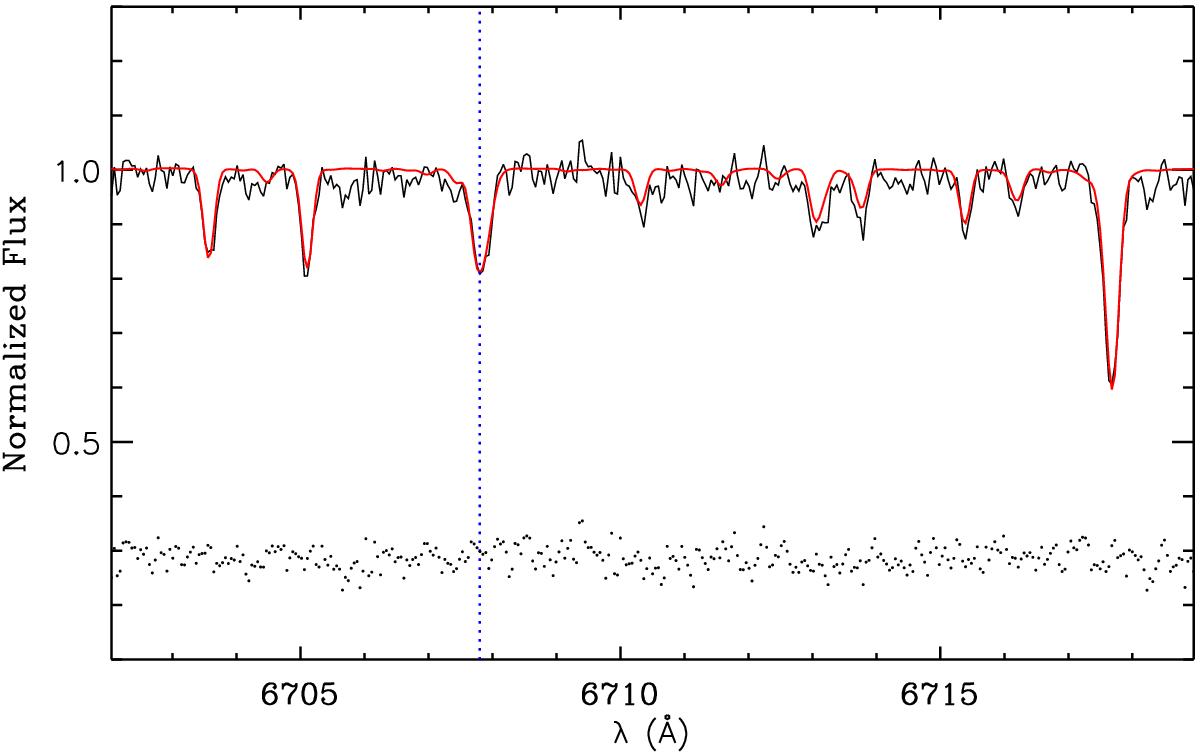
CAFE co-added spectrum of Kepler-539 (black line) encompassing the Li i 6707.8 Å absorption doublet. The best-fitting ATLAS9 spectrum is overplotted with a thick red line. The vertical dashed line indicates the position of the Li doublet. The lowest part of the plot shows the residuals to the fit.
Current usage metrics show cumulative count of Article Views (full-text article views including HTML views, PDF and ePub downloads, according to the available data) and Abstracts Views on Vision4Press platform.
Data correspond to usage on the plateform after 2015. The current usage metrics is available 48-96 hours after online publication and is updated daily on week days.
Initial download of the metrics may take a while.