Free Access
Fig. A.3
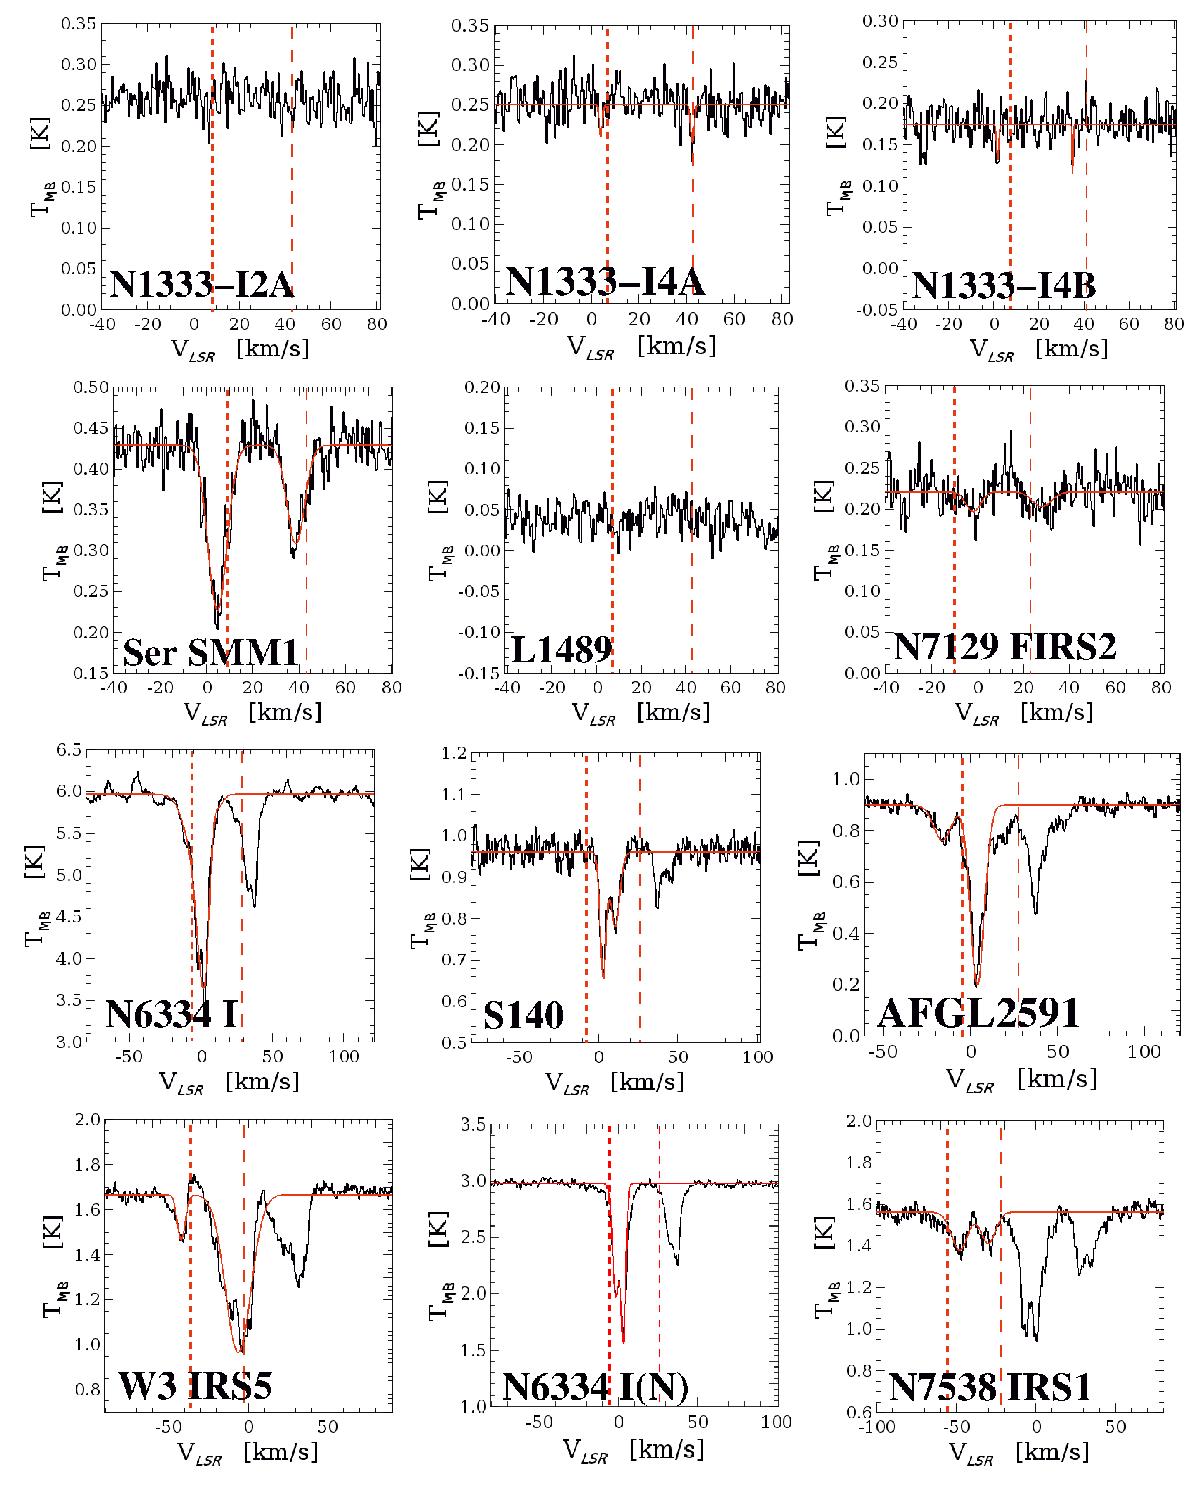
OH+(NJ = 11−01) lines at 1033 GHz. The positions of the two strongest fine structure lines, (![]() ) and (
) and (![]() ), are indicated, shifted by the systemic velocity of the YSOs. The thickness of the two lines indicates the relative theoretical intensities. Where the lines are detected, two Gaussians in red are fitted.
), are indicated, shifted by the systemic velocity of the YSOs. The thickness of the two lines indicates the relative theoretical intensities. Where the lines are detected, two Gaussians in red are fitted.
Current usage metrics show cumulative count of Article Views (full-text article views including HTML views, PDF and ePub downloads, according to the available data) and Abstracts Views on Vision4Press platform.
Data correspond to usage on the plateform after 2015. The current usage metrics is available 48-96 hours after online publication and is updated daily on week days.
Initial download of the metrics may take a while.