Fig. C.2
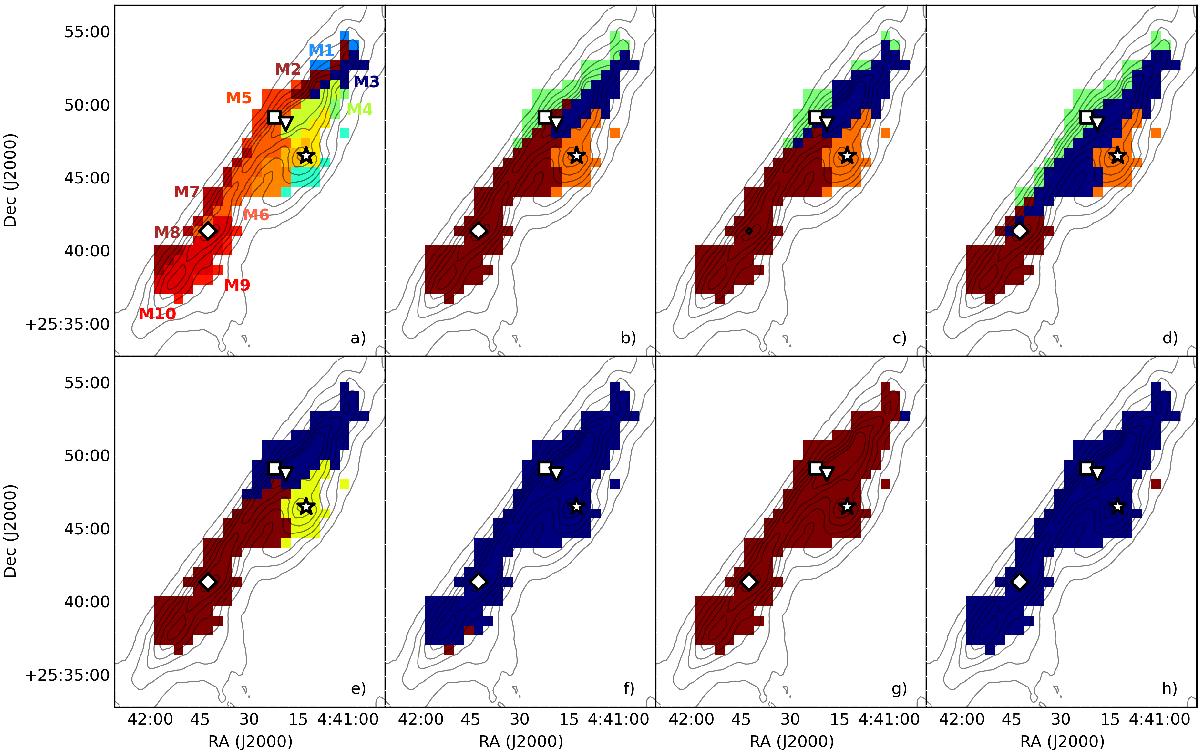
Best results of the other NbClust runs: HAC methods with a) McQuitty’s; b) Ward’s; c) Ward’s second; d) the complete; e) the average; f) the median; g) the centroid and h) the single criteria. N(H2) from Herschel and the positions of TMC-1 CP, IRAS 04381+2540, the SO peak, and our NH3 maximum are indicated as in Fig. 5a. The clusters in the main ridge on panel a) are numbered from M1 to M10 and discussed shortly in Sect. 4.2.3.
Current usage metrics show cumulative count of Article Views (full-text article views including HTML views, PDF and ePub downloads, according to the available data) and Abstracts Views on Vision4Press platform.
Data correspond to usage on the plateform after 2015. The current usage metrics is available 48-96 hours after online publication and is updated daily on week days.
Initial download of the metrics may take a while.