Fig. 5
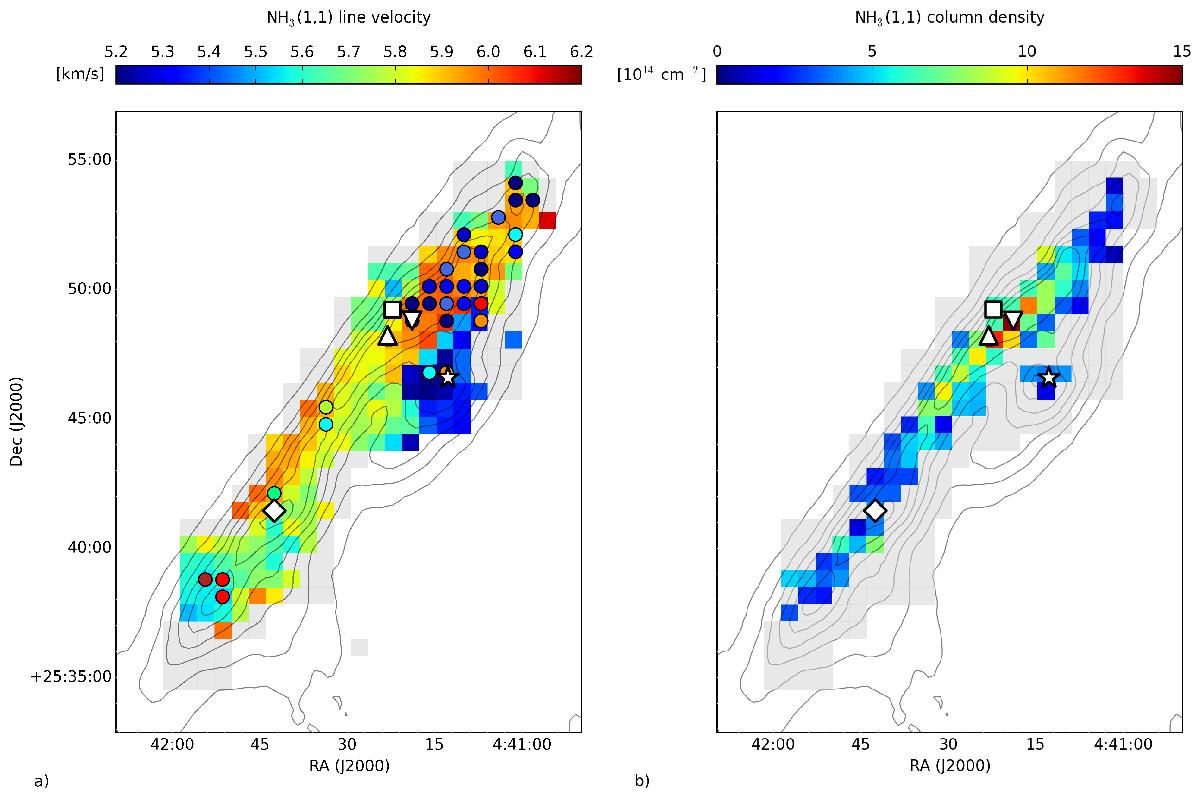
a): vLSR distribution of the main (or only) line component of the NH3(1, 1) lines with S/N> 3. Circles indicate the positions where a secondary component was found and their color corresponds to the velocity of this component. b): N(NH3(1, 1)) distribution map calculated on positions where the τ optical depth from single HFS profile fit had an error of less than 50%. The grey area shows the total extension of the observed NH3 map and the grey contours are the Herschel N(H2): 0.7, 1.0, 1.3, 1.6, 2, 2.3, 2.6 × 1022 cm-2 (from 20 to 80% of the maximum by 10%). The positions of TMC-1 CP, TMC-1(NH3), the SO peak, and IRAS 04381+2540 are indicated as before and the position of our NH3 peak is indicated with an upside down triangle.
Current usage metrics show cumulative count of Article Views (full-text article views including HTML views, PDF and ePub downloads, according to the available data) and Abstracts Views on Vision4Press platform.
Data correspond to usage on the plateform after 2015. The current usage metrics is available 48-96 hours after online publication and is updated daily on week days.
Initial download of the metrics may take a while.