Fig. 4
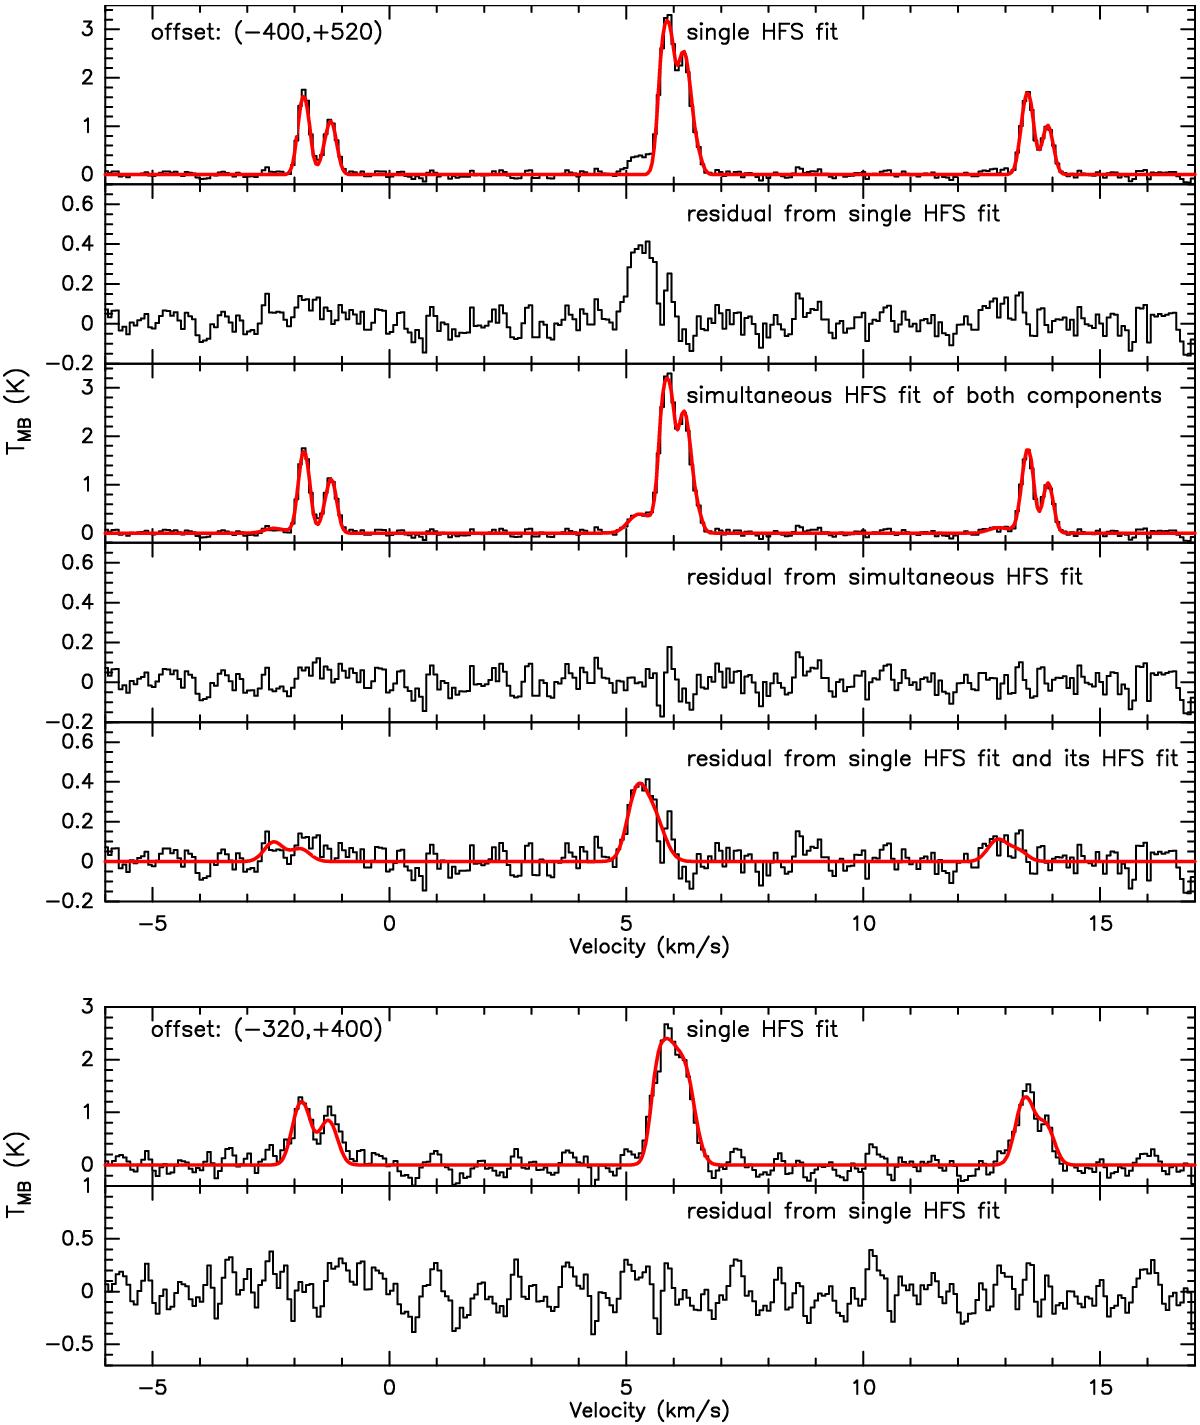
Top: multiple HFS line profile fitting of NH3(1, 1) on the (−400, 520) offset. The spectrum shows one of the brightest secondary line components and gives the lowest Tkin value; see position #4 in Table 2. Box 1: single HFS line profile fit; box 2: residual from the single HFS fit; box 3: simultaneous HFS profile fitting of both components; box 4: the residual from the simultaneous HFS fit; box 5: the residual from the single HFS fit with the HFS fit of the secondary component shown in box 4. Bottom: single NH3(1, 1) HFS line profile fit on position #8 and the residual after subtracting the fit. This position has the highest HFS linewidth from the spectra in Table 2. We note the different scales for the (1, 1) and (2, 2) lines.
Current usage metrics show cumulative count of Article Views (full-text article views including HTML views, PDF and ePub downloads, according to the available data) and Abstracts Views on Vision4Press platform.
Data correspond to usage on the plateform after 2015. The current usage metrics is available 48-96 hours after online publication and is updated daily on week days.
Initial download of the metrics may take a while.