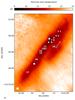
Fig. 3
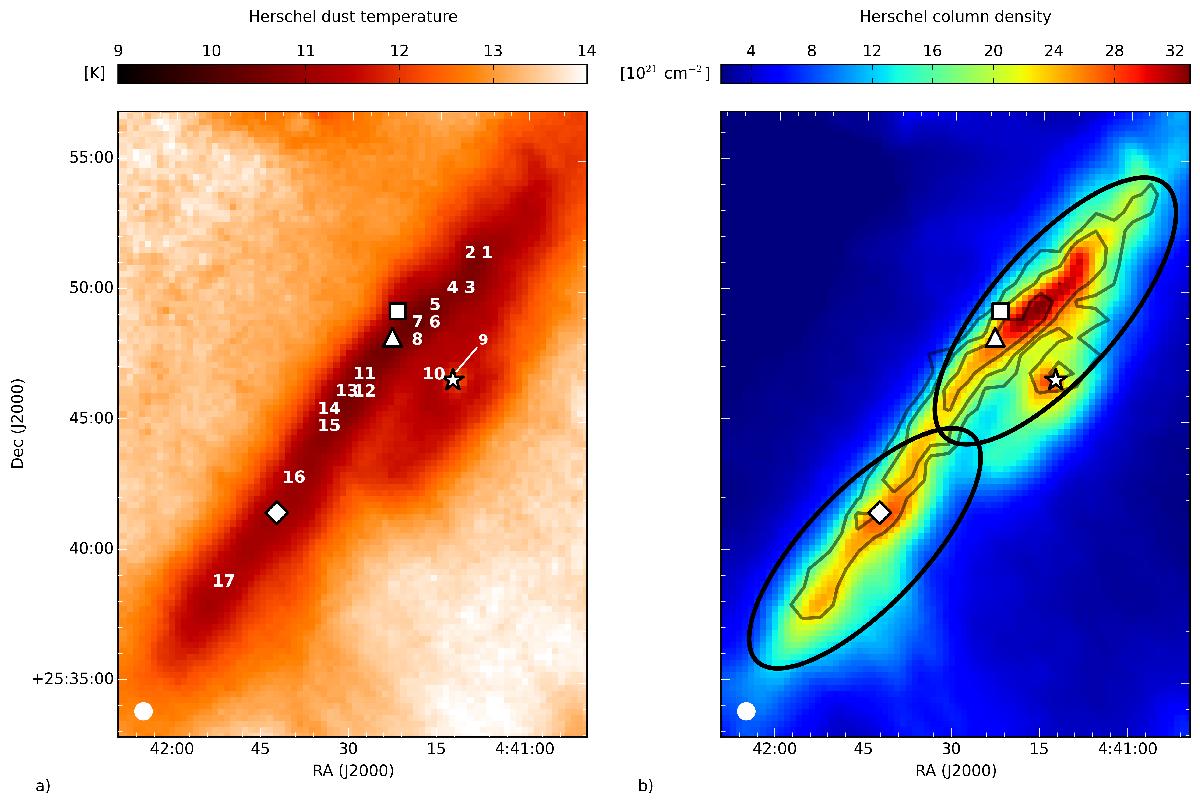
a): Herschel-based Tdust map of TMC-1. The numbers indicate the positions where high S/N NH3(1, 1) and (2, 2) spectra were taken and used to calculate the physical parameters of the gas (see Table 2). b) Herschel-based N(H2) map with the NH3(1, 1) main group integrated intensity contours: 0.6, 1.0, and 2.0 Kkm s-1 (20, 35, and 65% of the maximum). The secondary line components were subtracted from the spectra. Black ellipses indicate the two PGCCs in TMC-1. The positions of TMC-1 CP, TMC-1(NH3), the SO peak, and IRAS 04381+2540 are indicated with a diamond, a triangle, a square, and an asterisk, respectively. HPBW of 40″ is shown in the left bottom corner.
Current usage metrics show cumulative count of Article Views (full-text article views including HTML views, PDF and ePub downloads, according to the available data) and Abstracts Views on Vision4Press platform.
Data correspond to usage on the plateform after 2015. The current usage metrics is available 48-96 hours after online publication and is updated daily on week days.
Initial download of the metrics may take a while.