Free Access
Fig. 1
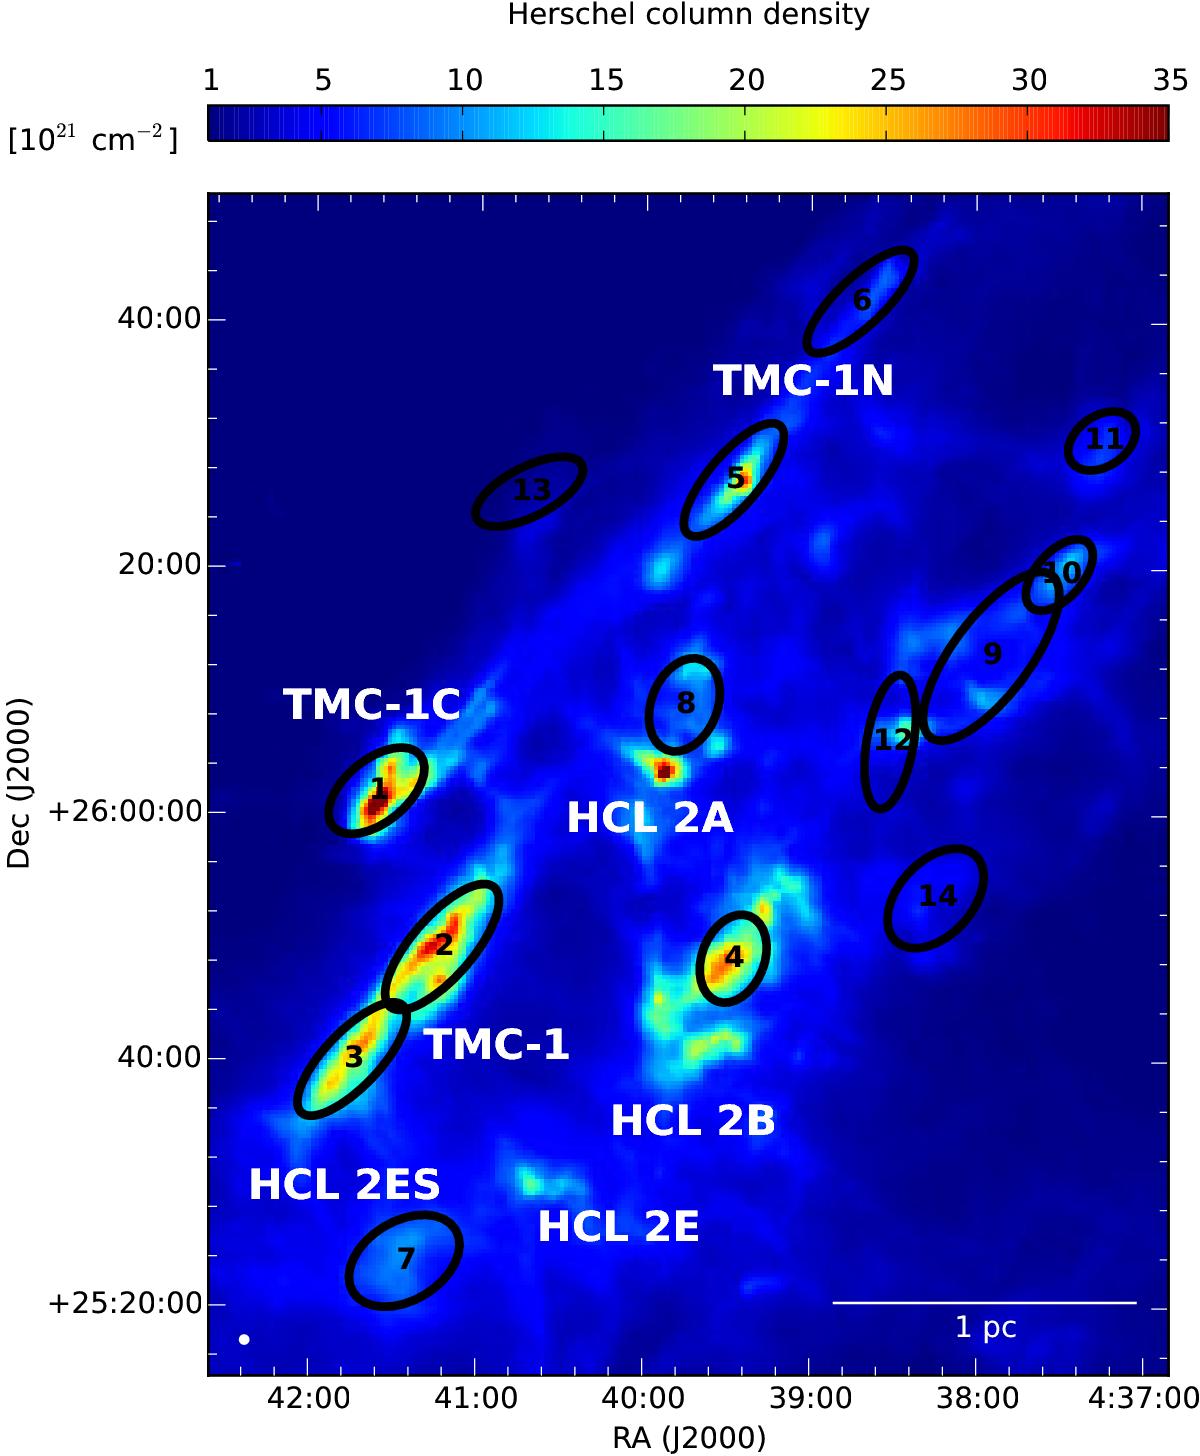
Herschel N(H2) column density map of HCL 2 and the main parts of the cloud. PGCCs with flux quality of 1 and 2 are plotted with black ellipses and the numbers refer to Table 1, which lists the properties of the PGCCs.
Current usage metrics show cumulative count of Article Views (full-text article views including HTML views, PDF and ePub downloads, according to the available data) and Abstracts Views on Vision4Press platform.
Data correspond to usage on the plateform after 2015. The current usage metrics is available 48-96 hours after online publication and is updated daily on week days.
Initial download of the metrics may take a while.