Fig. 1
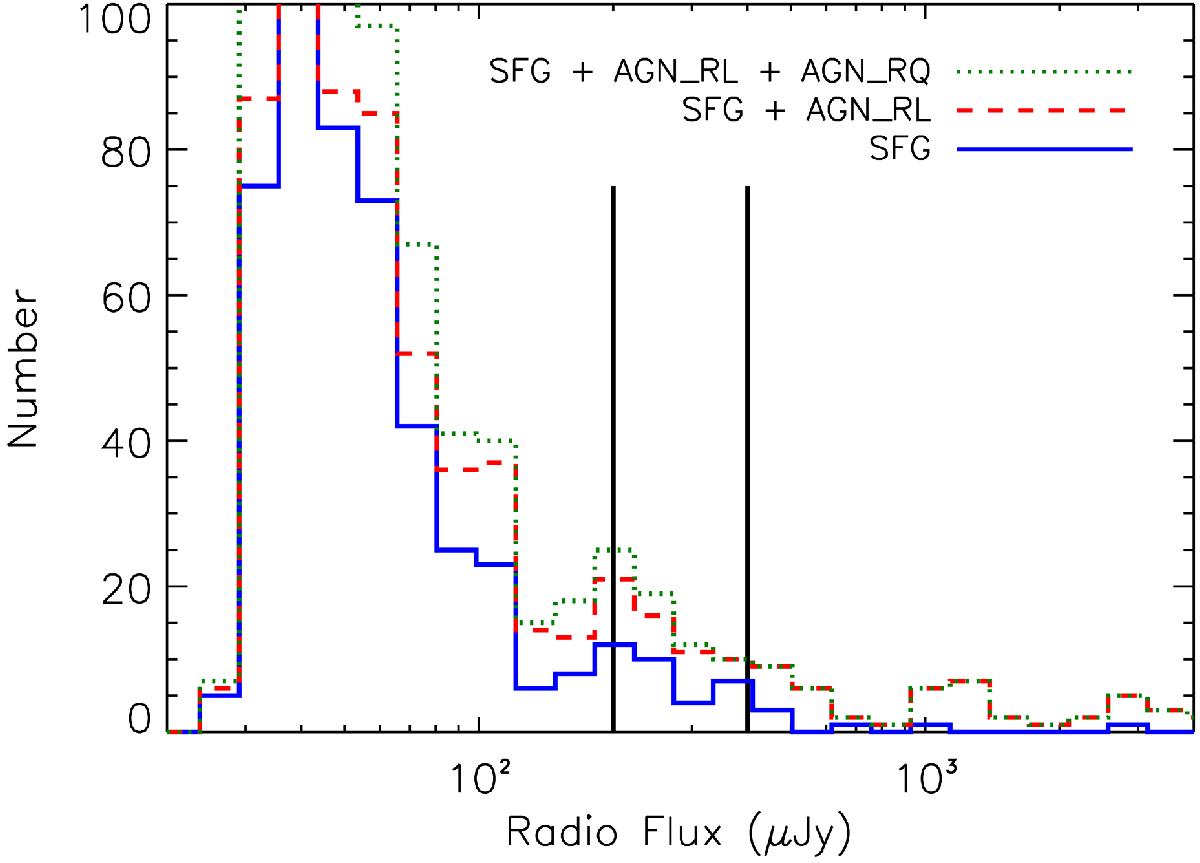
Stacked histogram of the radio flux density distributions of the sources in Bonzini et al. (2013). The solid blue curve refers to SFGs, the red dashed curve adds to it the RL AGNs, the green dotted curve adds to them the secure (QF = 3) RQ AGNs. The two black vertical lines delimit the flux range of the sample we targeted (200–400 μJy).
Current usage metrics show cumulative count of Article Views (full-text article views including HTML views, PDF and ePub downloads, according to the available data) and Abstracts Views on Vision4Press platform.
Data correspond to usage on the plateform after 2015. The current usage metrics is available 48-96 hours after online publication and is updated daily on week days.
Initial download of the metrics may take a while.