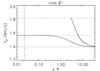
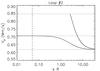
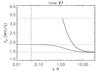
Fig. 7
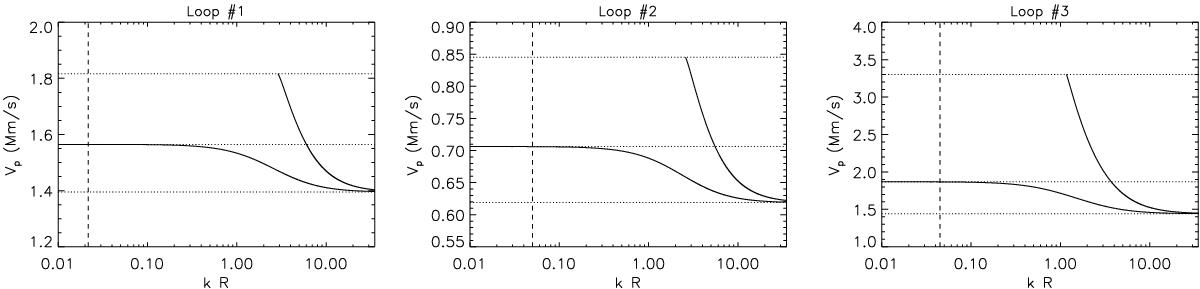
Dispersion diagrams for the analysed loops showing the phase speed Vp of the kink and sausage modes as a function of the normalised wavenumber kR. The upper, middle, and lower dotted lines represent CAe, Ck, and CA0, respectively. A logarithmic scale is used to emphasise the behaviour in the long wavelength limit kR ≪ 1. The dashed lines correspond to the value for the global standing mode kR = πR/L.
Current usage metrics show cumulative count of Article Views (full-text article views including HTML views, PDF and ePub downloads, according to the available data) and Abstracts Views on Vision4Press platform.
Data correspond to usage on the plateform after 2015. The current usage metrics is available 48-96 hours after online publication and is updated daily on week days.
Initial download of the metrics may take a while.