Free Access
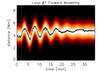
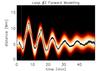
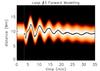
Fig. 6
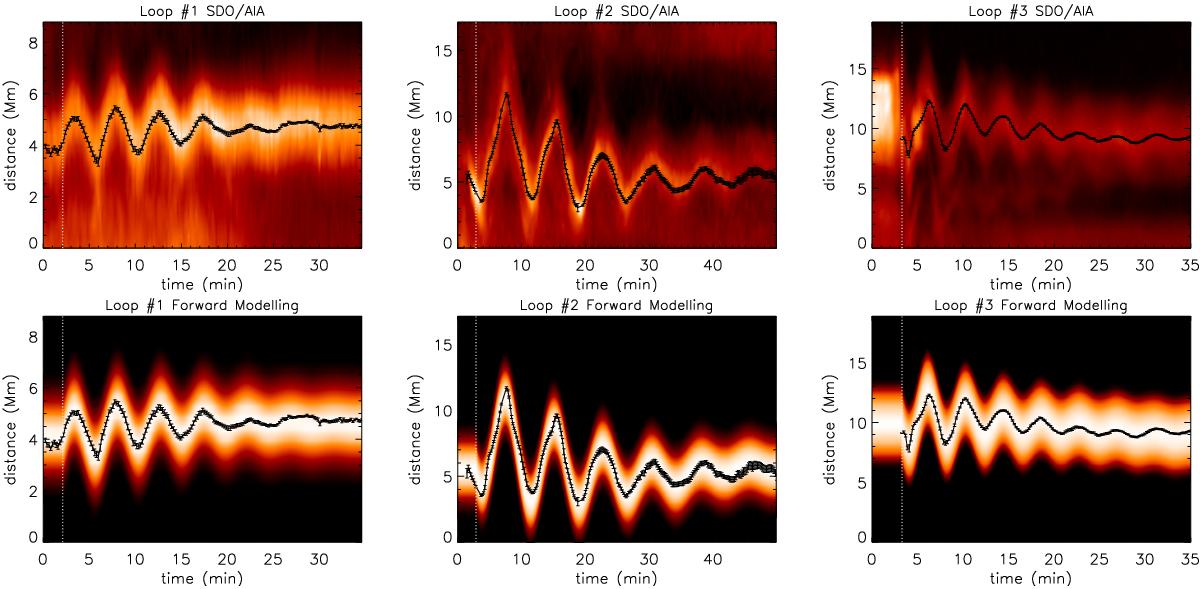
Comparison of observational TD maps (top) with those produced by forward modelling (bottom) using the parameters given in Tables 2 and 3. The vertical dashed lines denote the start time of the oscillation. The symbols are the fitted locations of the loop centre for the observational data (see also Fig. 2).
This figure is made of several images, please see below:
Current usage metrics show cumulative count of Article Views (full-text article views including HTML views, PDF and ePub downloads, according to the available data) and Abstracts Views on Vision4Press platform.
Data correspond to usage on the plateform after 2015. The current usage metrics is available 48-96 hours after online publication and is updated daily on week days.
Initial download of the metrics may take a while.