Fig. 3
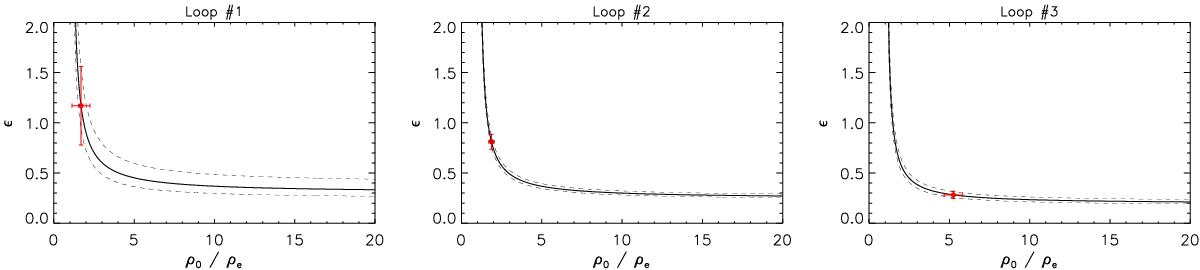
Seismological inversions for the density contrast ratio and normalised layer width based on the kink mode damping profile. Using the exponential damping time τd alone produces a curve of possible values (error bars denoted by dashed lines). Using the general damping profile given by Eq. (6) determines ϵ and ρ0/ρe simultaneously (red symbols with error bars).
Current usage metrics show cumulative count of Article Views (full-text article views including HTML views, PDF and ePub downloads, according to the available data) and Abstracts Views on Vision4Press platform.
Data correspond to usage on the plateform after 2015. The current usage metrics is available 48-96 hours after online publication and is updated daily on week days.
Initial download of the metrics may take a while.