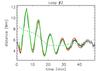
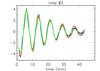
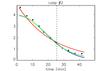
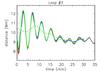
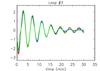
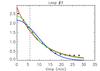
Fig. 2
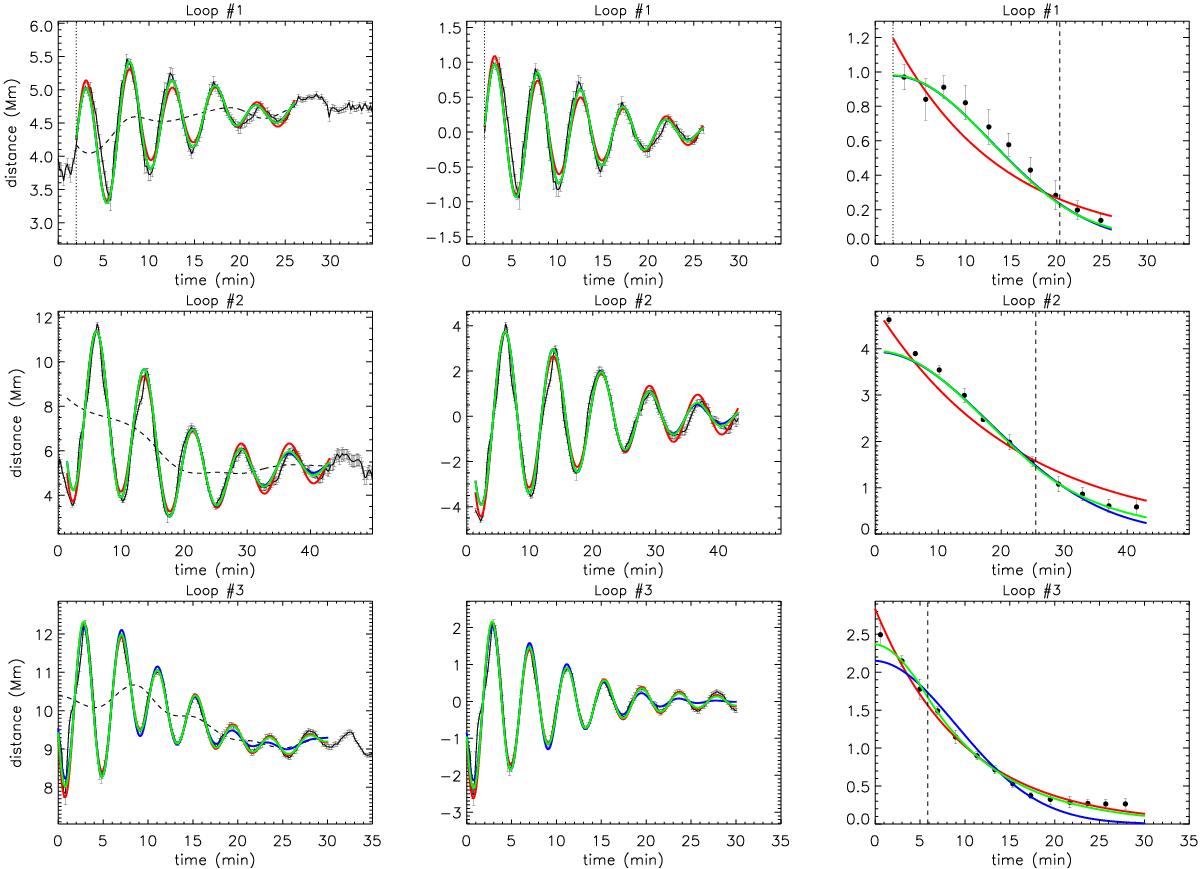
Kink oscillations fitted with a general damping profile. Left panels: locations of the loop axis as a function of time for the three loops we consider. The background trends are shown by the dashed lines and the detrended signals are shown in the middle panels. Right panels: absolute values of the detrended extrema with the damping envelopes. The best fit curves correspond to exponential (red), Gaussian (blue), and general damping (green) profiles. The vertical dotted and dashed lines denote the start time of the oscillation and the switch time ts, respectively.
Current usage metrics show cumulative count of Article Views (full-text article views including HTML views, PDF and ePub downloads, according to the available data) and Abstracts Views on Vision4Press platform.
Data correspond to usage on the plateform after 2015. The current usage metrics is available 48-96 hours after online publication and is updated daily on week days.
Initial download of the metrics may take a while.