Free Access
Fig. 9
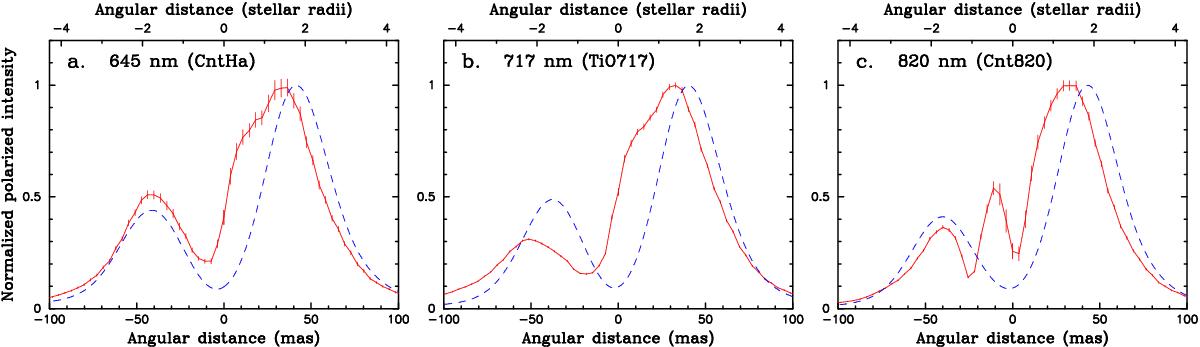
North-south 1D cuts of the polarized intensity of W Hya at 645 nm (panel a)), 717 nm (panel b)), and 820 nm (panel c)). In each panel, the red solid line represents the observed data, while the blue dashed line represents the model.
Current usage metrics show cumulative count of Article Views (full-text article views including HTML views, PDF and ePub downloads, according to the available data) and Abstracts Views on Vision4Press platform.
Data correspond to usage on the plateform after 2015. The current usage metrics is available 48-96 hours after online publication and is updated daily on week days.
Initial download of the metrics may take a while.