Fig. 8
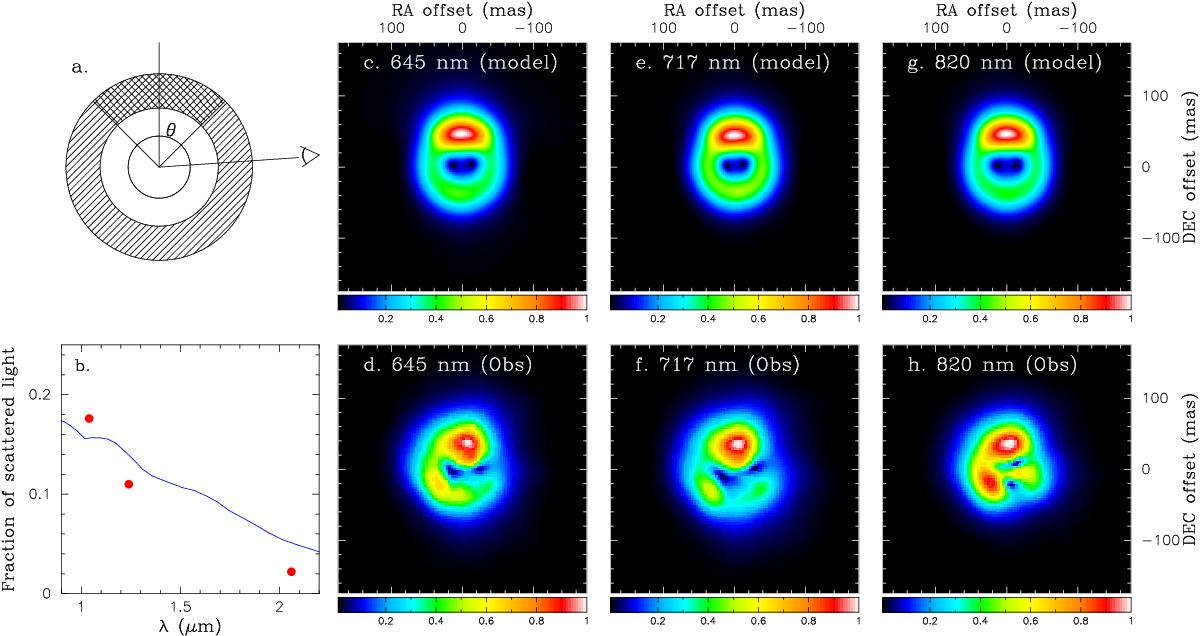
Dust clump model of W Hya. a) Schematic view of our model. The hatched region is the spherical dust shell. The cross-hatched region represents a cone-shaped density enhancement, which is characterized by the half-opening angle θ. The viewing angle of the model is also shown. b) Fraction of scattered light derived by Norris et al. (2012) is plotted by the red dots (the errors are approximately the same as the size of the dots), while the model prediction is shown by the blue solid line. c)–h) Model and observed polarized intensity maps at 645, 717, and 820 nm. North is up, east to the left.
Current usage metrics show cumulative count of Article Views (full-text article views including HTML views, PDF and ePub downloads, according to the available data) and Abstracts Views on Vision4Press platform.
Data correspond to usage on the plateform after 2015. The current usage metrics is available 48-96 hours after online publication and is updated daily on week days.
Initial download of the metrics may take a while.