Fig. 7
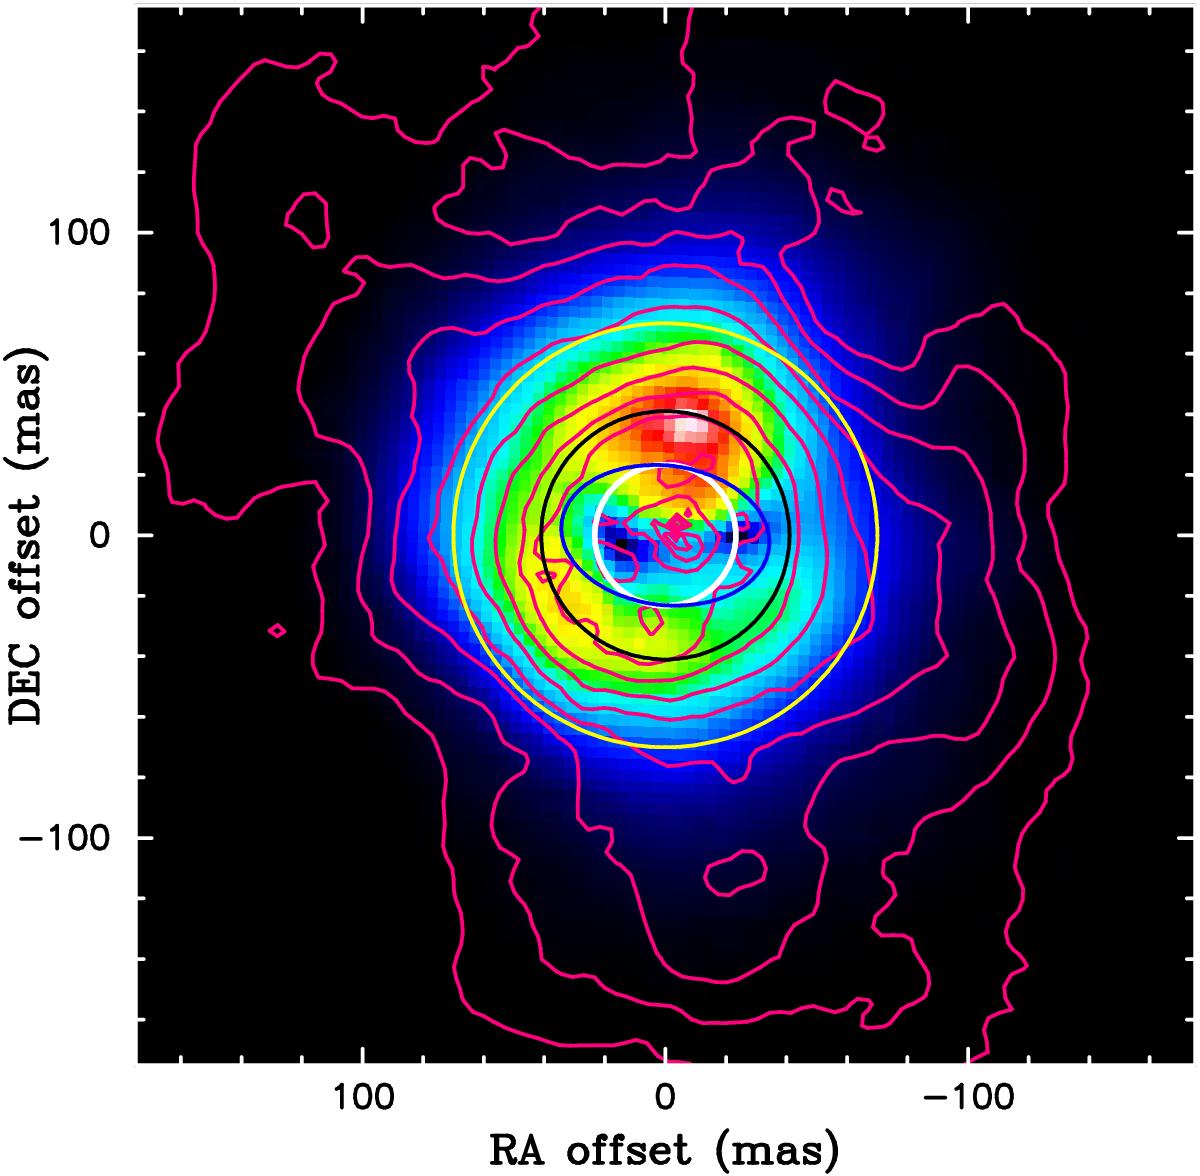
Overlay of the distribution of dust (polarized intensity at 645 nm, color scale image), hot gas (Hα emission, contours), and the molecular gas (extension of the atmosphere derived from the AMBER data in the CO lines, outer yellow circle). The inner white circle represents the size of the star derived from the AMBER data in the continuum. The blue ellipse and the middle black circle represent the size of the radio photosphere and the SiO maser shell measured at 43 GHz by Reid & Menten (2007), respectively. The contours are plotted in logarithmic scale. The lowest and highest contours correspond to 3% and 100% of the maximum value, respectively. North is up, east to the left.
Current usage metrics show cumulative count of Article Views (full-text article views including HTML views, PDF and ePub downloads, according to the available data) and Abstracts Views on Vision4Press platform.
Data correspond to usage on the plateform after 2015. The current usage metrics is available 48-96 hours after online publication and is updated daily on week days.
Initial download of the metrics may take a while.