Fig. 1
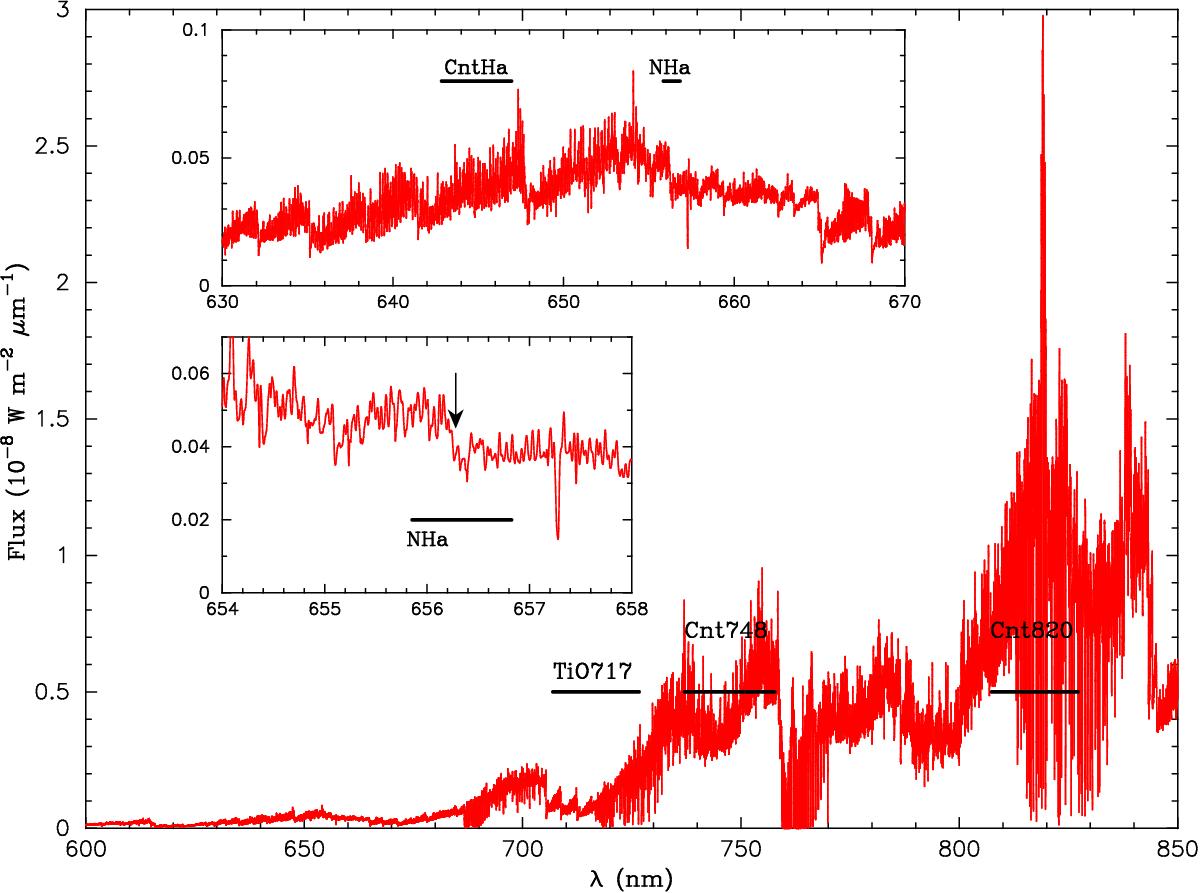
High resolution visible spectrum of W Hya. The spectrum is based on the data obtained by Uttenthaler et al. (2011), and we applied the flux calibration to their spectrum as described in Sect. 2.1. The FWHMs of five filters used in our SPHERE-ZIMPOL observations are marked with the horizontal bars. The insets show enlarged views of the spectral region of the CntHa and NHa filters. The arrow in the lower inset marks the position of the Hα line.
Current usage metrics show cumulative count of Article Views (full-text article views including HTML views, PDF and ePub downloads, according to the available data) and Abstracts Views on Vision4Press platform.
Data correspond to usage on the plateform after 2015. The current usage metrics is available 48-96 hours after online publication and is updated daily on week days.
Initial download of the metrics may take a while.