Fig. 1
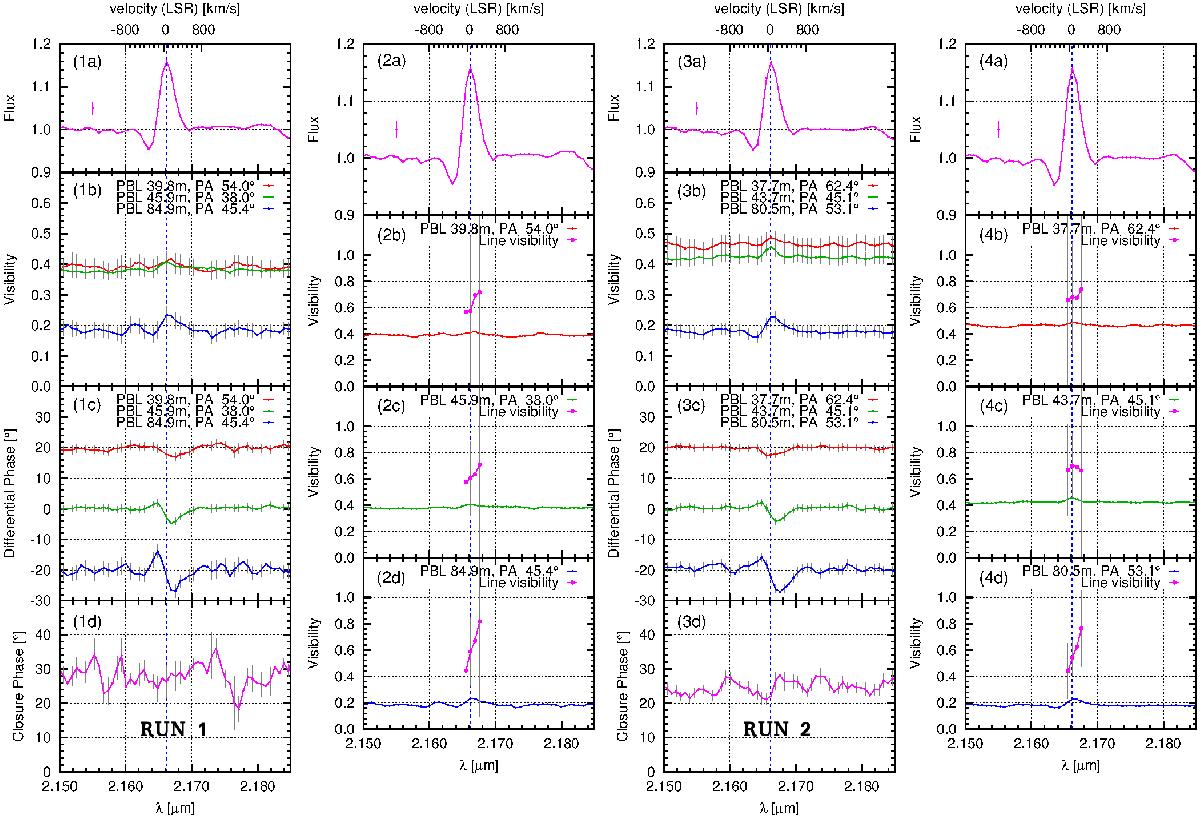
Left: panel 1. AMBER-MR interferometric measurements of the Brγ line in IRAS 13481-6124 for run 1 (inserts 1a–1d). From top to bottom: line flux (1a), wavelength-dependent visibilities (1b), differential phases (1c), and closure phase (1d), observed at three different projected baselines (see labels in figure). For clarity, the differential phases of the first and last baselines are shifted by +20° and −20°, respectively. Middle left: panel 2. Visibilities and continuum-corrected (pure) Brγ-line visibilities of our AMBER-MR observation of IRAS 13481-6124 for run 1 (inserts 2b–2d). From top to bottom: line flux (2a), visibilities of first (2b), second (2c) and third baseline (2d). Middle right: panel 3. AMBER-MR interferometric measurements of the Brγ line in IRAS 13481-6124 for run 2 (inserts 3a–3d). Right: panel 4. Visibilities and continuum-corrected (pure) Brγ-line visibilities of our AMBER-MR observation of IRAS 13481-6124 for run 2 (inserts 4b–4d). Blue dashed lines encompass the emission peak of the Brγ line.
Current usage metrics show cumulative count of Article Views (full-text article views including HTML views, PDF and ePub downloads, according to the available data) and Abstracts Views on Vision4Press platform.
Data correspond to usage on the plateform after 2015. The current usage metrics is available 48-96 hours after online publication and is updated daily on week days.
Initial download of the metrics may take a while.