Fig. 8
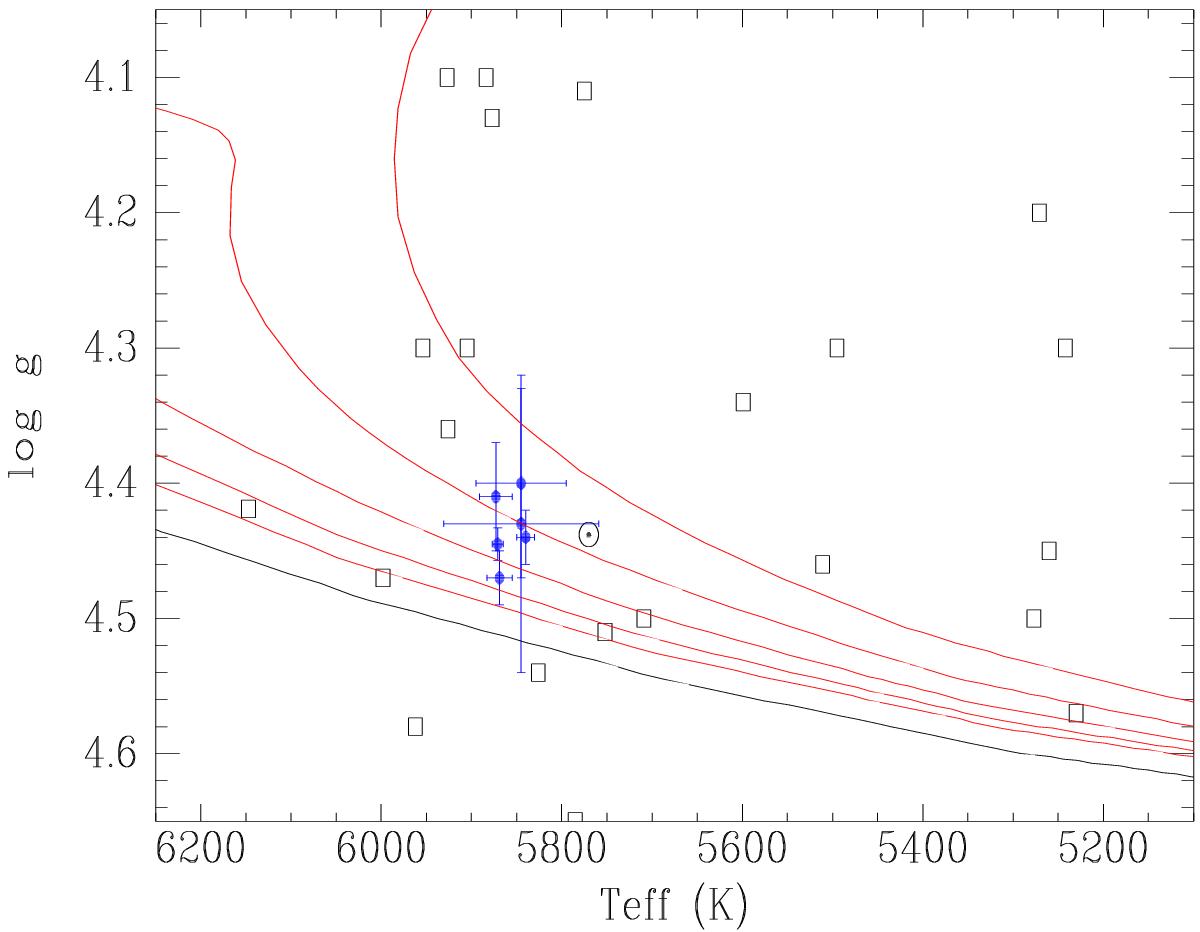
Position of G-type stars with activity cycles in the Teff−log g diagram (black empty squares). Blue filled circles with error bars correspond to the parameters of HD 45184 derived by different authors. Red lines are isochrones for solar abundances shown for log age = 9.0, 9.2, 9.4, 9.6, and 9.8; the black line is the ZAMS. The position of the Sun is also included in the figure.
Current usage metrics show cumulative count of Article Views (full-text article views including HTML views, PDF and ePub downloads, according to the available data) and Abstracts Views on Vision4Press platform.
Data correspond to usage on the plateform after 2015. The current usage metrics is available 48-96 hours after online publication and is updated daily on week days.
Initial download of the metrics may take a while.