Free Access
Fig. 3
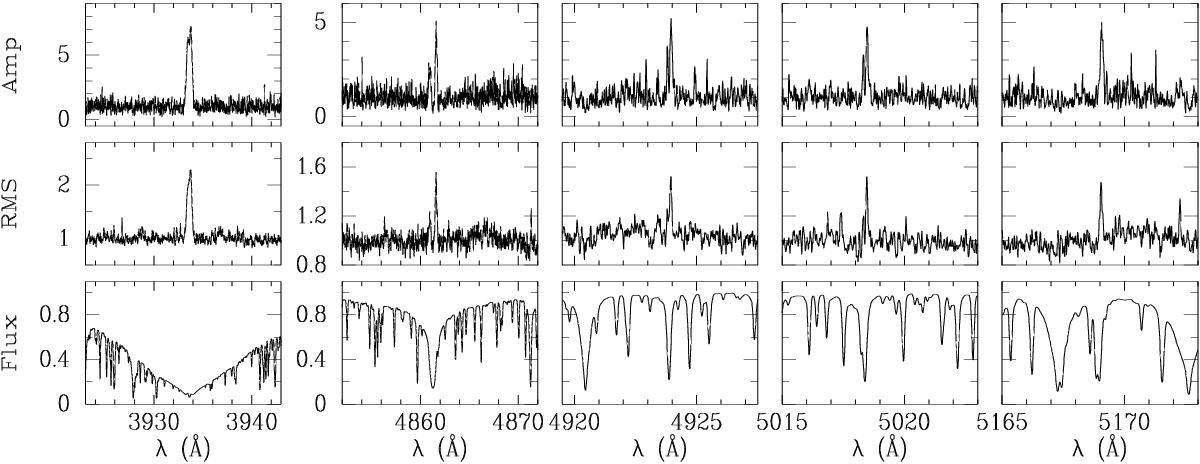
Spectral variability. Light-variation amplitude spectrum (upper panels) and rms spectrum (middle panels) are shown for a small spectral windows around five variable spectral lines: Ca ii 3933, Fe ii 4924, Fe ii 5018, and Fe ii 5169. Lower panels: average spectrum in each region.
Current usage metrics show cumulative count of Article Views (full-text article views including HTML views, PDF and ePub downloads, according to the available data) and Abstracts Views on Vision4Press platform.
Data correspond to usage on the plateform after 2015. The current usage metrics is available 48-96 hours after online publication and is updated daily on week days.
Initial download of the metrics may take a while.