Free Access
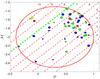
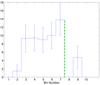
Fig. 3
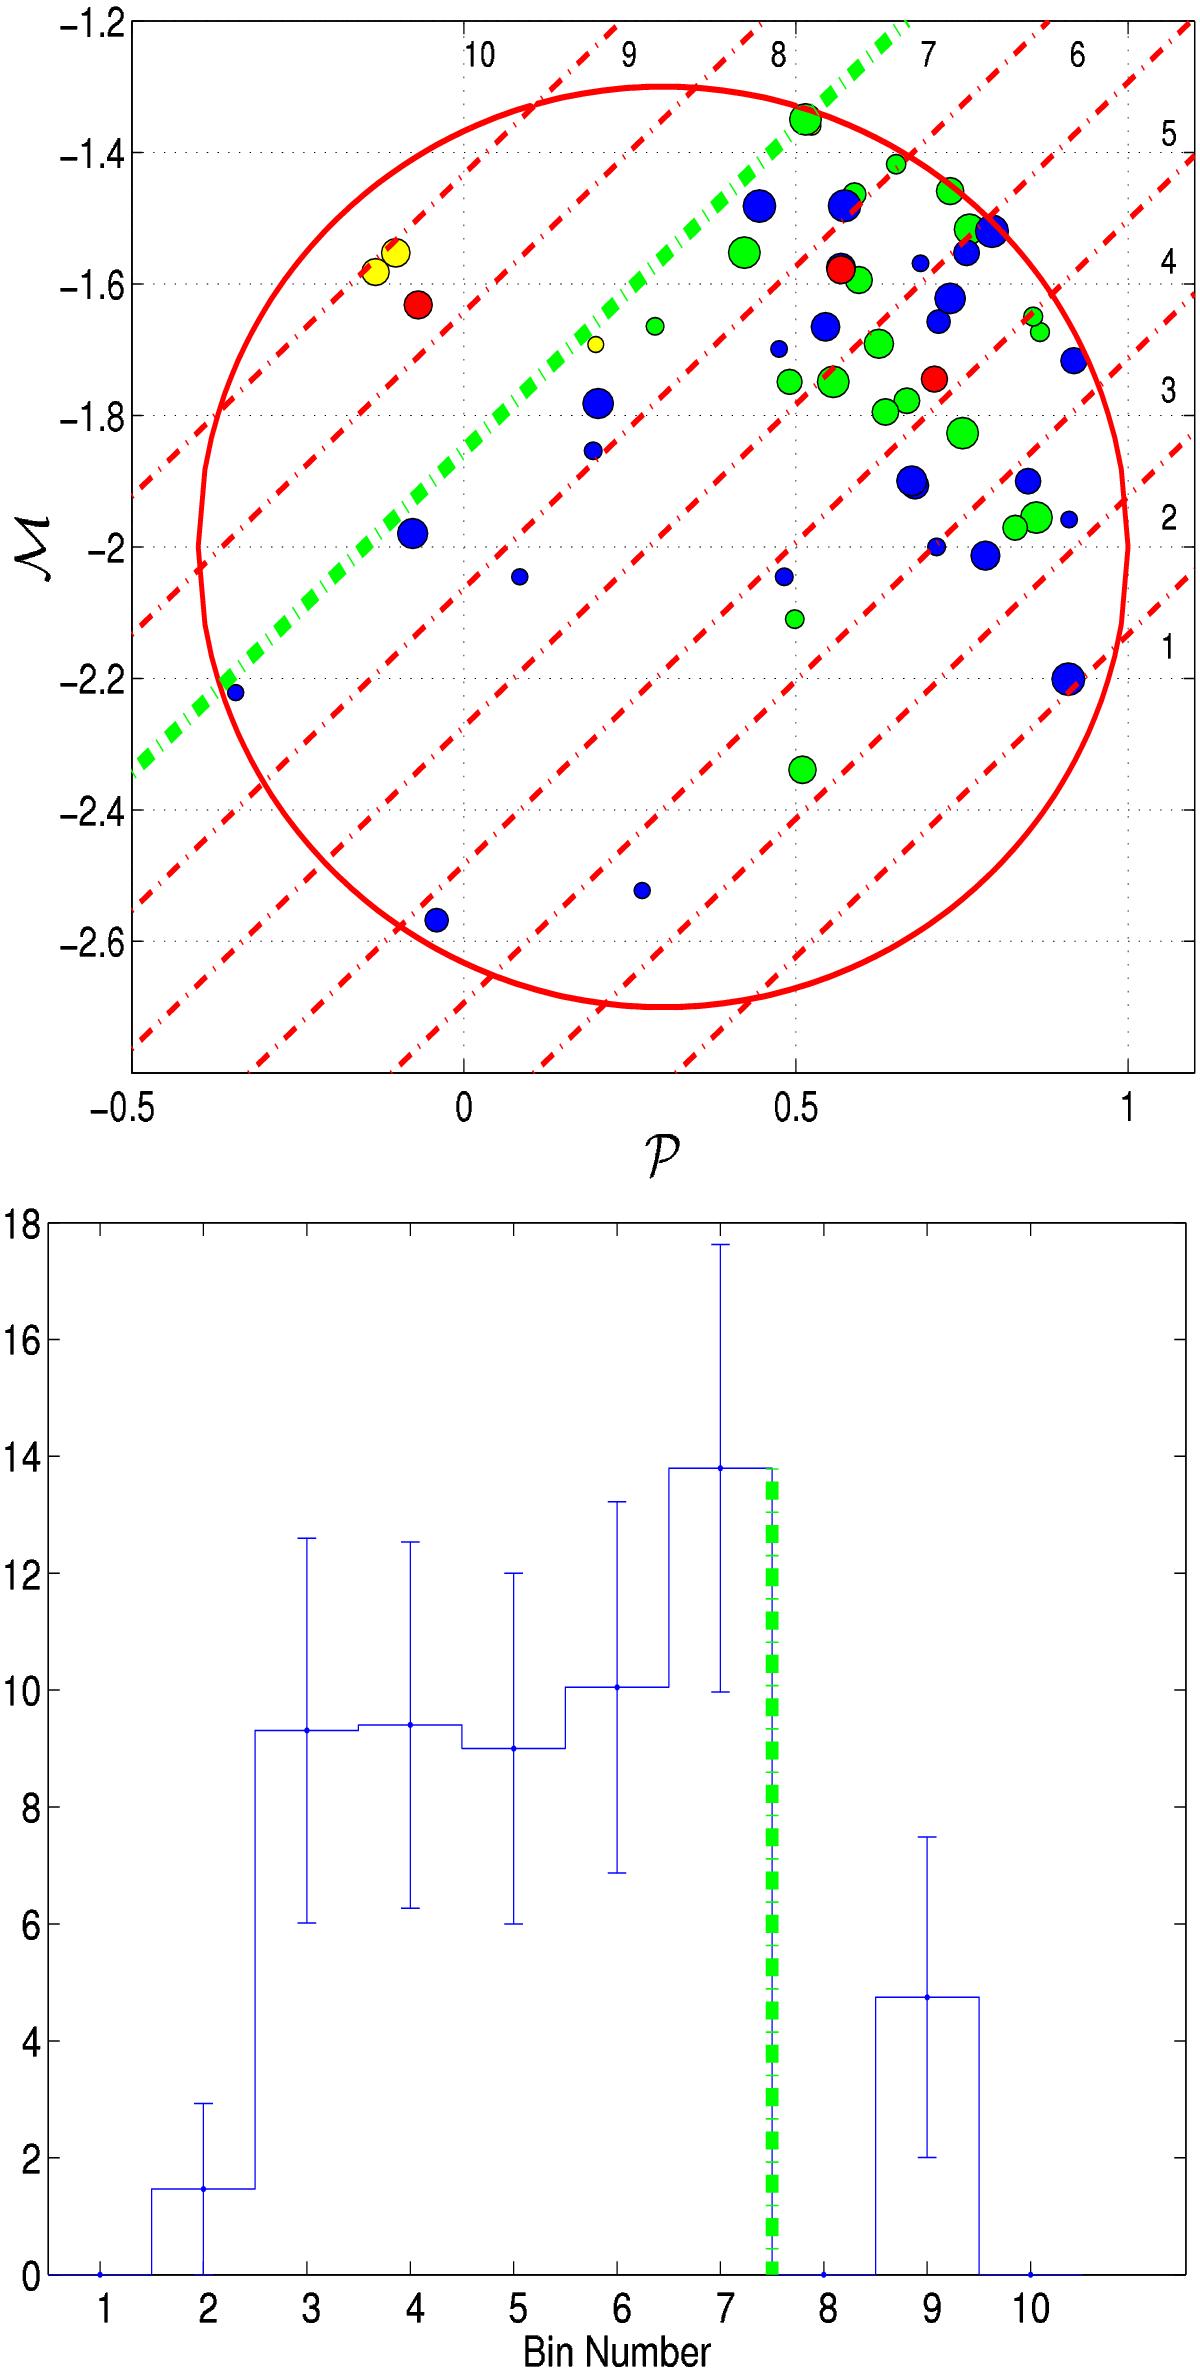
Upper panel: planetary masses as a function of planetary orbital periods for planets inside the circle, divided into ten stripes. Lower panel: histogram plot of the number of planets in each stripe, normalized to the stripe area inside the circle.
This figure is made of several images, please see below:
Current usage metrics show cumulative count of Article Views (full-text article views including HTML views, PDF and ePub downloads, according to the available data) and Abstracts Views on Vision4Press platform.
Data correspond to usage on the plateform after 2015. The current usage metrics is available 48-96 hours after online publication and is updated daily on week days.
Initial download of the metrics may take a while.