Fig. 1
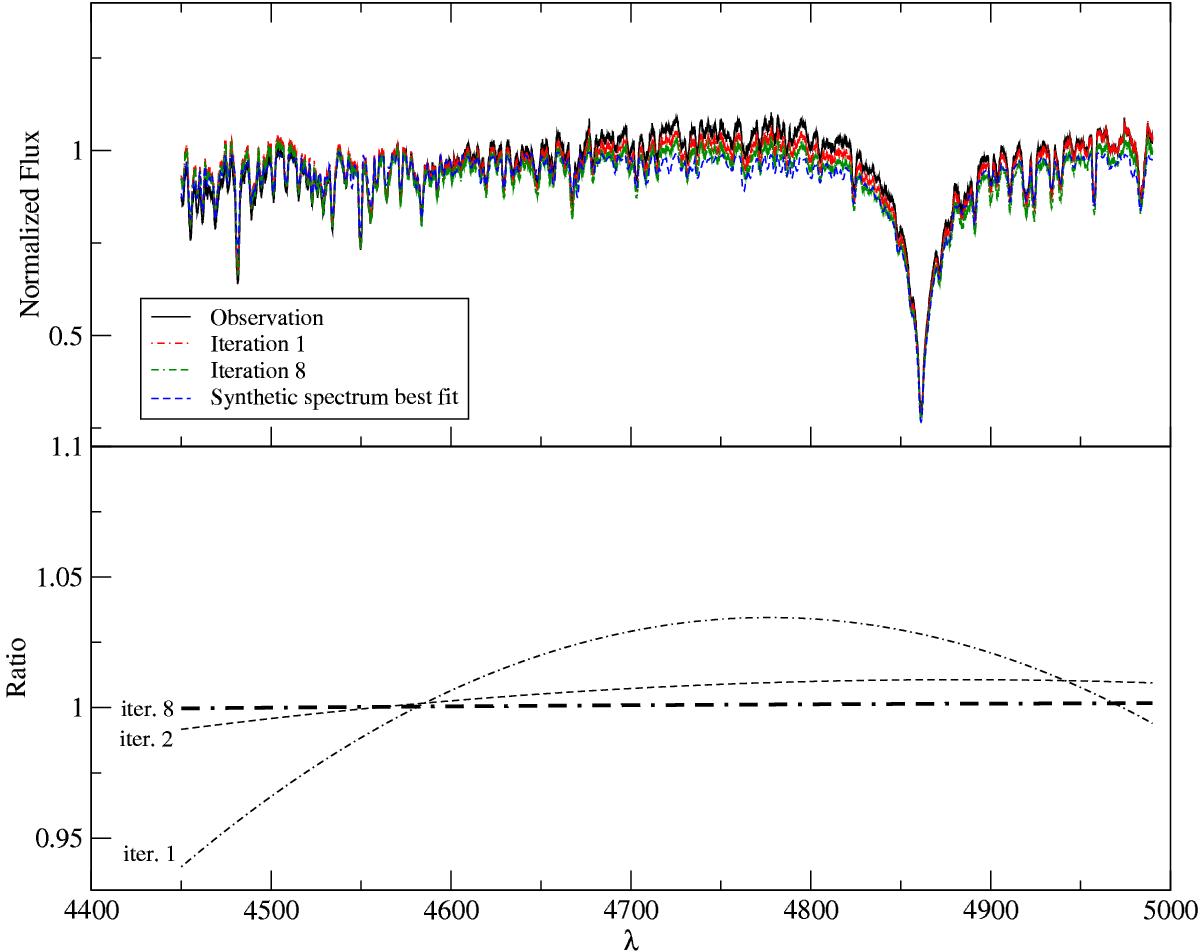
Upper panel: continuum correction using eight iterations for the inversion of HD 97230. Only iterations 1 and 8 are shown for the sake of clarity, The initial observation is indicated with a solid line, the 1st iteration is indicated with dash-dotted line, the 8th iteration is indicated with double dash-dotted line, and the final best-fit synthetic spectrum is indicated with a dashed line. Lower panel: ratios between the re-normalized spectrum of the observation and the first neighbour best-fit synthetic spectrum for iterations 1, 2, and 8.
Current usage metrics show cumulative count of Article Views (full-text article views including HTML views, PDF and ePub downloads, according to the available data) and Abstracts Views on Vision4Press platform.
Data correspond to usage on the plateform after 2015. The current usage metrics is available 48-96 hours after online publication and is updated daily on week days.
Initial download of the metrics may take a while.