Fig. 1
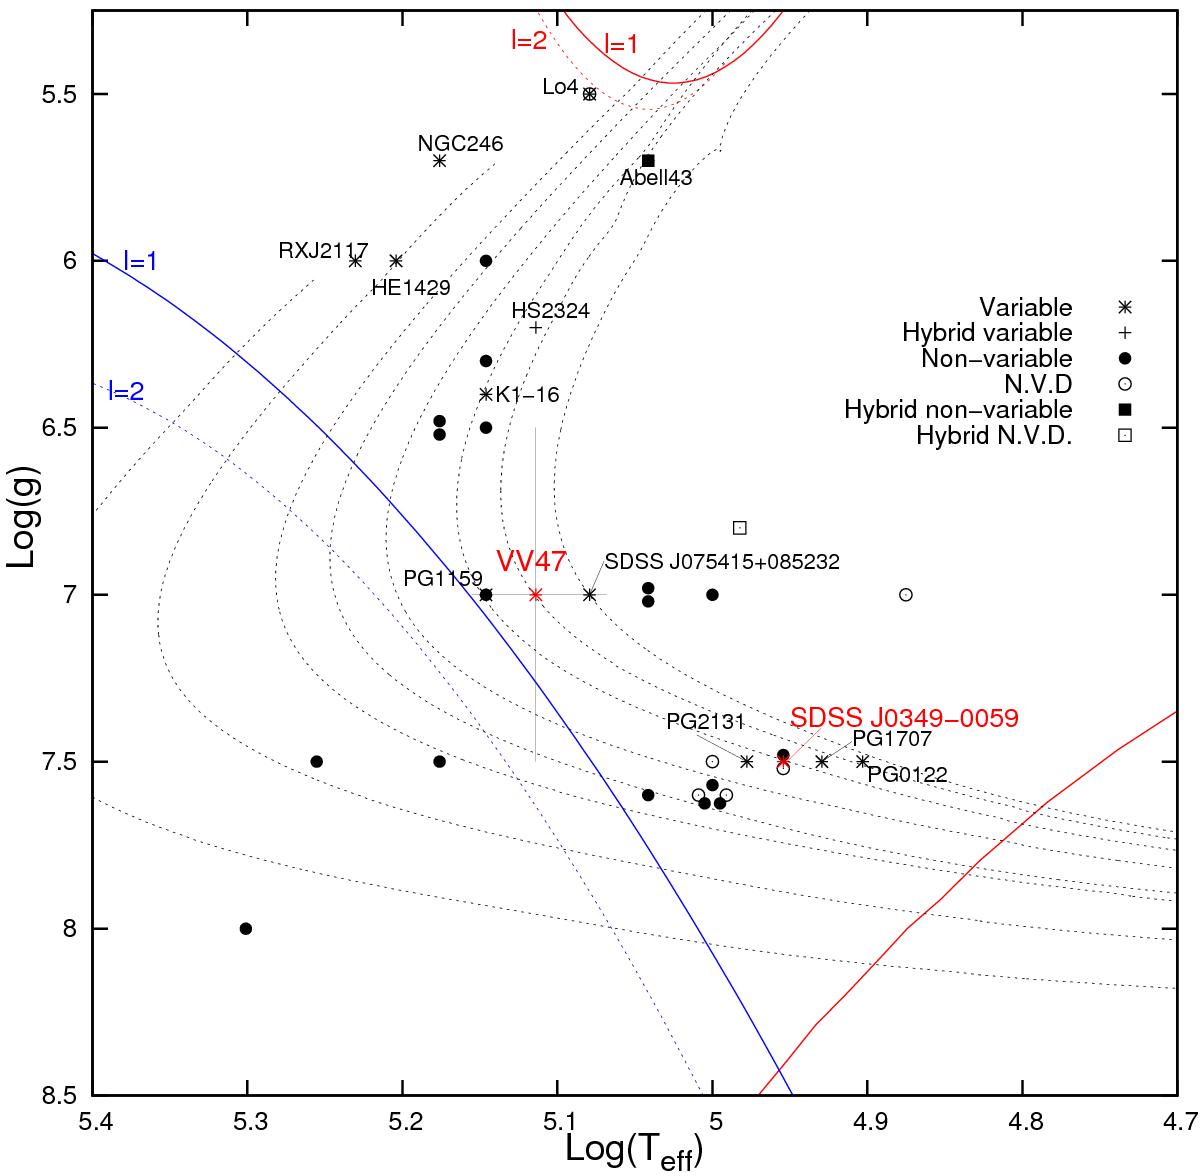
PG 1159 (VLTP) evolutionary tracks of Miller Bertolami & Althaus (2006; from right to left: M⋆ = 0.515, 0.530, 0.542, 0.565, 0.589, 0.609, 0.664, 0.741 M⊙) in the log Teff − log g diagram (thin dotted curves). The location of all known PG 1159 stars (variable, non-variable, and objects with no variability data) is shown, including SDSS J0349−0059 and VV 47 with their uncertainties. The uncertainty values for SDSS J0349−0059 are very low in the adopted scale and are not visible in the plot. The hot blue edges (blue curves) and the low-gravity red edges (upper red curves) of the theoretical GW Vir instability strip for ℓ = 1 (dashed) and ℓ = 2 (dotted) modes according to Córsico et al. (2006) are also depicted. The high-gravity red edge that is due to the competition of residual stellar winds against the gravitational settling of C and O (Quirion et al. 2012) is also included (lower red solid curve).
Current usage metrics show cumulative count of Article Views (full-text article views including HTML views, PDF and ePub downloads, according to the available data) and Abstracts Views on Vision4Press platform.
Data correspond to usage on the plateform after 2015. The current usage metrics is available 48-96 hours after online publication and is updated daily on week days.
Initial download of the metrics may take a while.