Free Access
Fig. 2
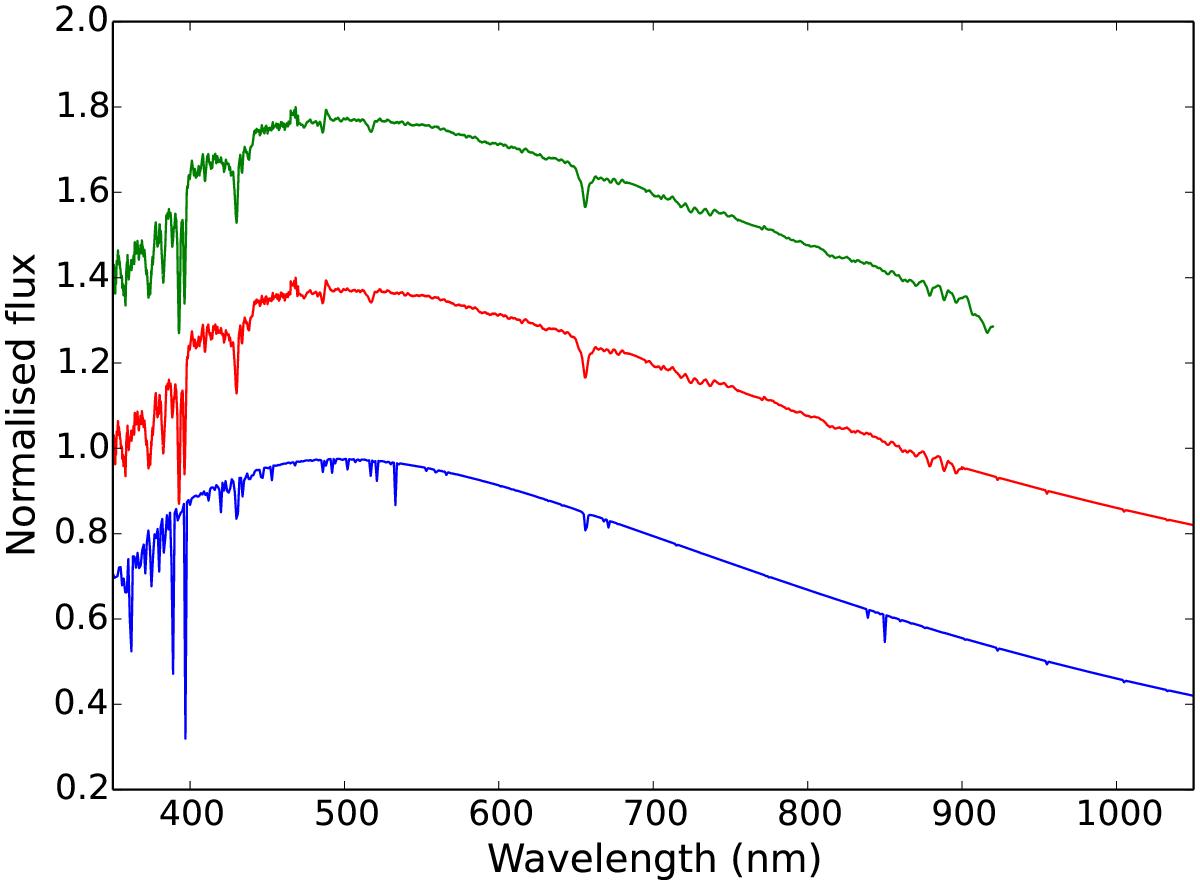
The spectra of G158-100. The top green line is the measured spectrum (Oke 1990), the bottom blue line the model, and the central red line the combined spectrum. All curves are scaled to a peak flux of 1.0, and are offset for clarity.
Current usage metrics show cumulative count of Article Views (full-text article views including HTML views, PDF and ePub downloads, according to the available data) and Abstracts Views on Vision4Press platform.
Data correspond to usage on the plateform after 2015. The current usage metrics is available 48-96 hours after online publication and is updated daily on week days.
Initial download of the metrics may take a while.