Fig. 1
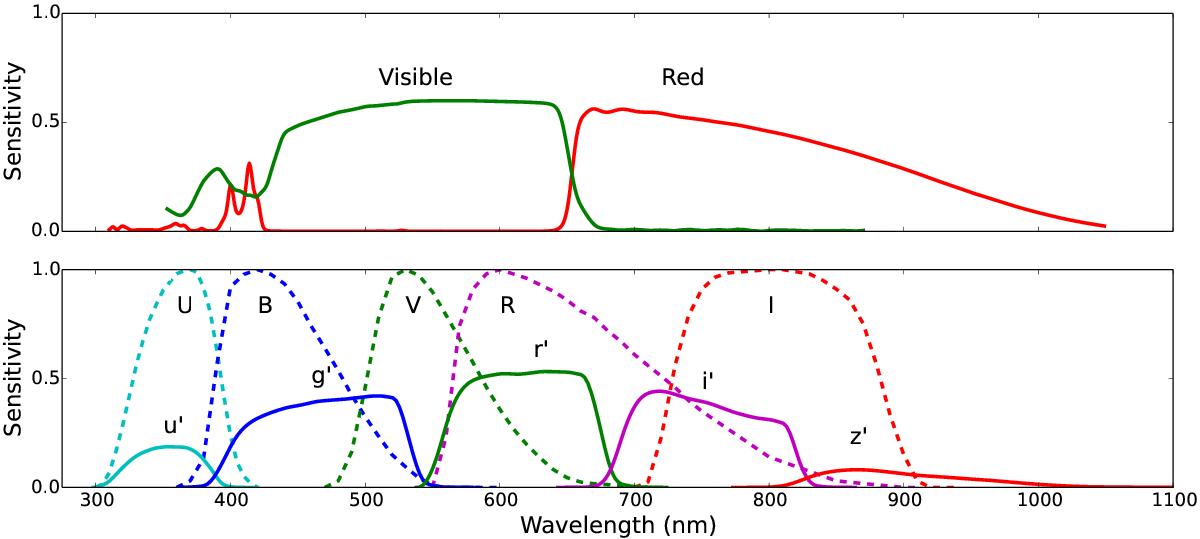
Top panel: the theoretical response curves of the two TCI cameras, based on the properties of the dichroics, the quantum efficiencies of the cameras, and an assumed telescope transmission efficiency of 65%. Bottom panel: for comparison, the normalised response curves of the standard Johnson-Cousins UBVRI, and the measured sensitivity of the SDSS u′g′r′i′z′ cameras. Atmospheric effects are not included. This figure is adapted from Fig. 4 of Skottfelt et al. (2015b), with the permission of the author. The SDSS curves are based on a sensitivity determination made by J. Gunn in June 2001, available at http://www.sdss3.org/instruments/camera.php
Current usage metrics show cumulative count of Article Views (full-text article views including HTML views, PDF and ePub downloads, according to the available data) and Abstracts Views on Vision4Press platform.
Data correspond to usage on the plateform after 2015. The current usage metrics is available 48-96 hours after online publication and is updated daily on week days.
Initial download of the metrics may take a while.