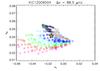
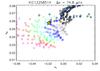
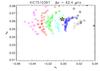
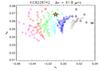
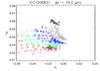
Fig. 6
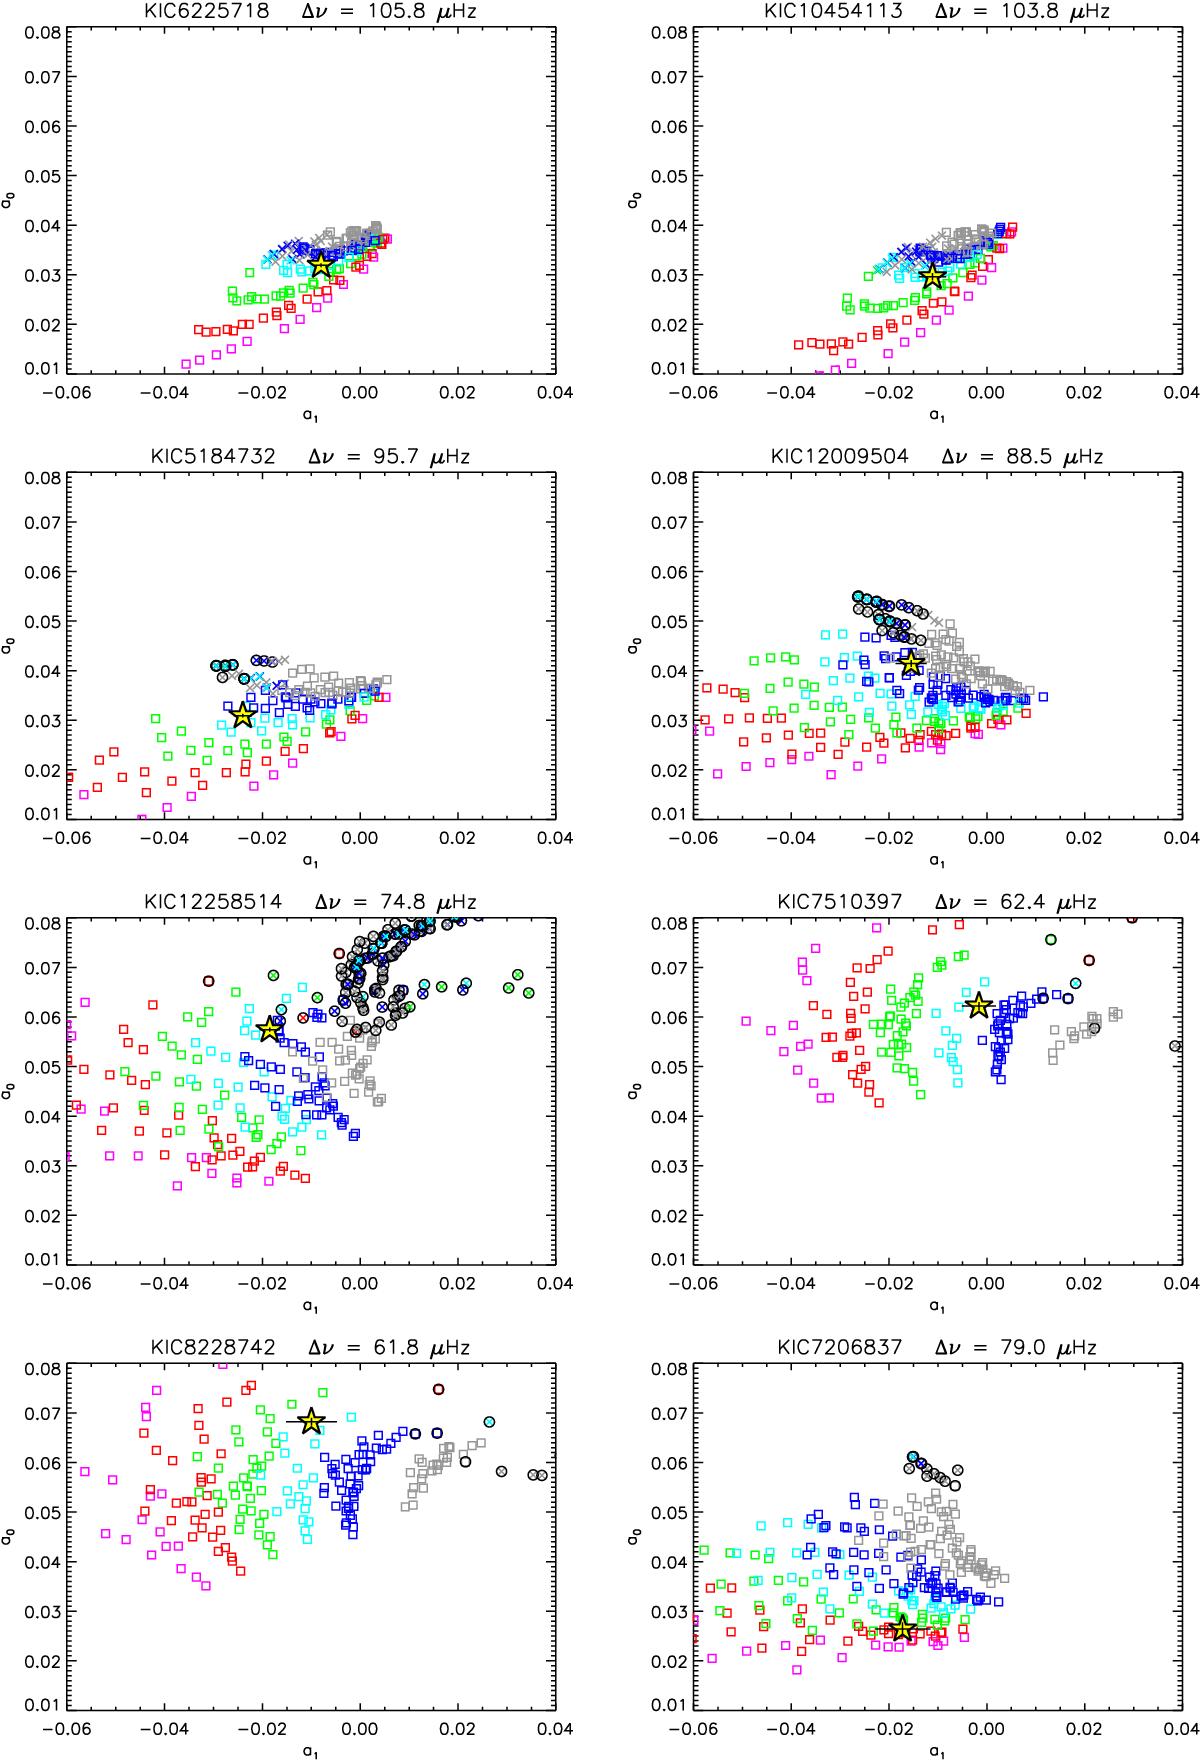
Location in the (a1,a0) plane (star symbols and black error bars) of the stars of the sample that were found to be on the MS with a convective core in this study. Models that reproduce the observed large separation, the spectroscopic estimate of metallicity, and the stellar mass derived from scaling laws within 3σ errors are overplotted. The symbols have the same meaning as in Fig. 4.
Current usage metrics show cumulative count of Article Views (full-text article views including HTML views, PDF and ePub downloads, according to the available data) and Abstracts Views on Vision4Press platform.
Data correspond to usage on the plateform after 2015. The current usage metrics is available 48-96 hours after online publication and is updated daily on week days.
Initial download of the metrics may take a while.