Fig. 5

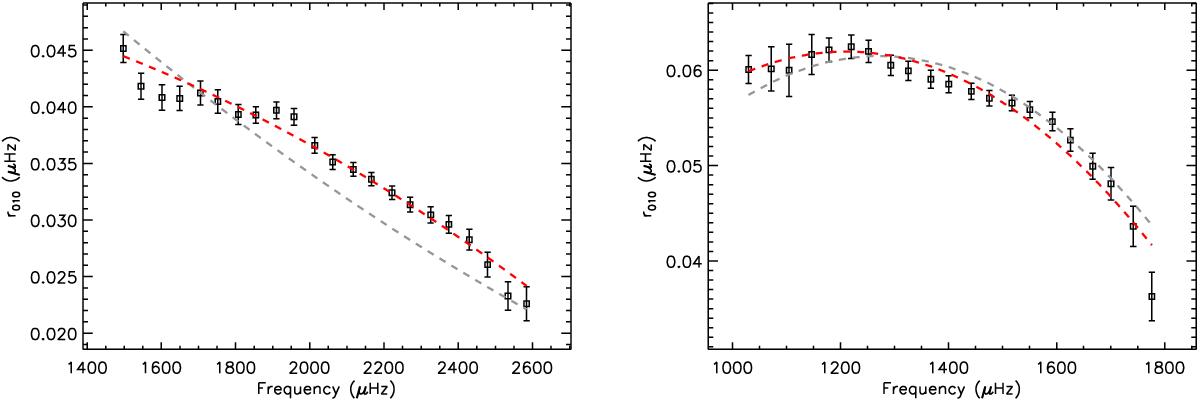
Ratios r010 computed for KIC 6106415 (left) and KIC 12258514 (right) using the mode frequencies extracted from the Kepler oscillation spectra (see text). The colored dashed lines correspond to 2nd-order polynomial fits to the observed ratios using either the raw covariance matrix (gray lines) or the covariance matrix modified through truncated SVD (see Sect. 3.3).
Current usage metrics show cumulative count of Article Views (full-text article views including HTML views, PDF and ePub downloads, according to the available data) and Abstracts Views on Vision4Press platform.
Data correspond to usage on the plateform after 2015. The current usage metrics is available 48-96 hours after online publication and is updated daily on week days.
Initial download of the metrics may take a while.


