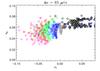
Fig. 4
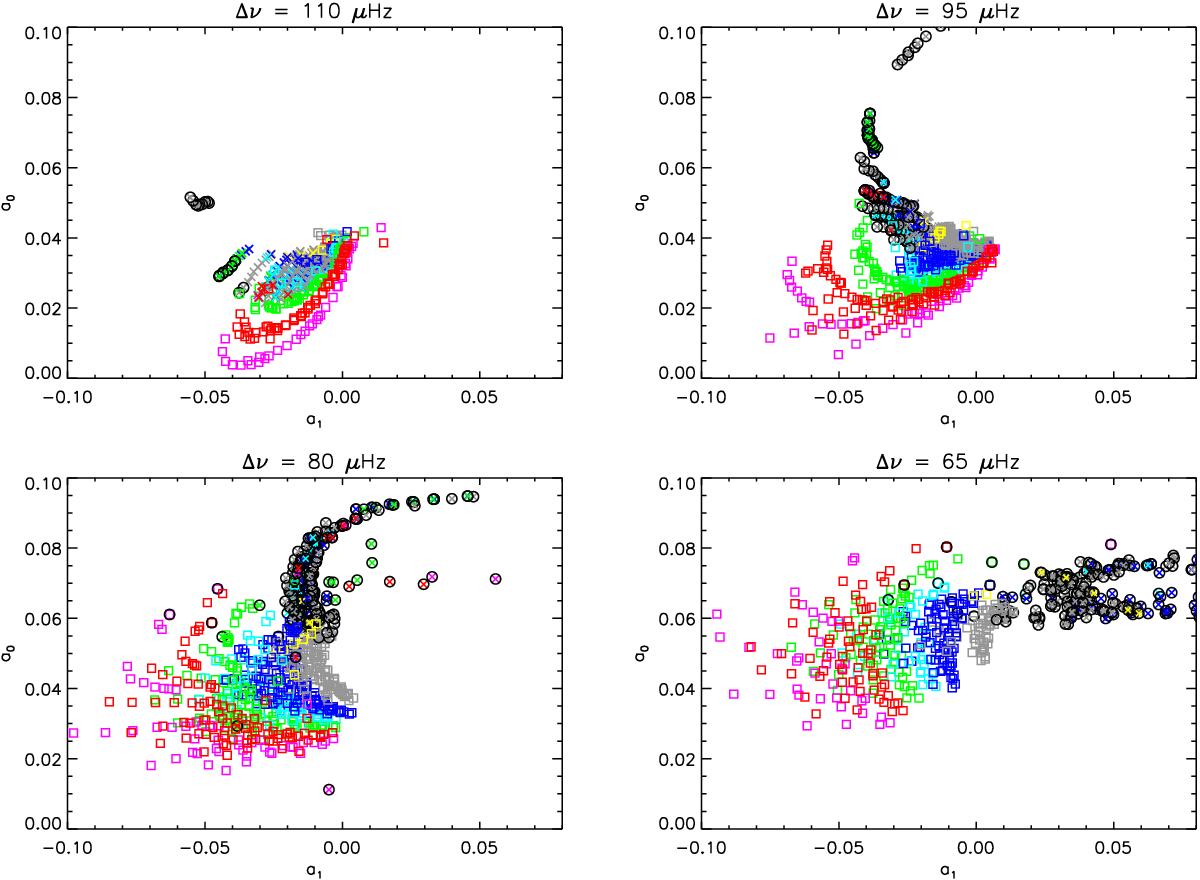
Location of models in the (a1,a0) plane at fixed Δν. Colors indicate the amount of core overshooting: αov = 0 (gray), 0.1 (blue), 0.15 (cyan), 0.2 (green), 0.25 (red), 0.3 (magenta). Open squares indicate models with a convective core, and crosses, models with radiative cores. The black open circles indicate models that are in the post-main-sequence (Xc< 10-2).
Current usage metrics show cumulative count of Article Views (full-text article views including HTML views, PDF and ePub downloads, according to the available data) and Abstracts Views on Vision4Press platform.
Data correspond to usage on the plateform after 2015. The current usage metrics is available 48-96 hours after online publication and is updated daily on week days.
Initial download of the metrics may take a while.