Free Access
Fig. 15
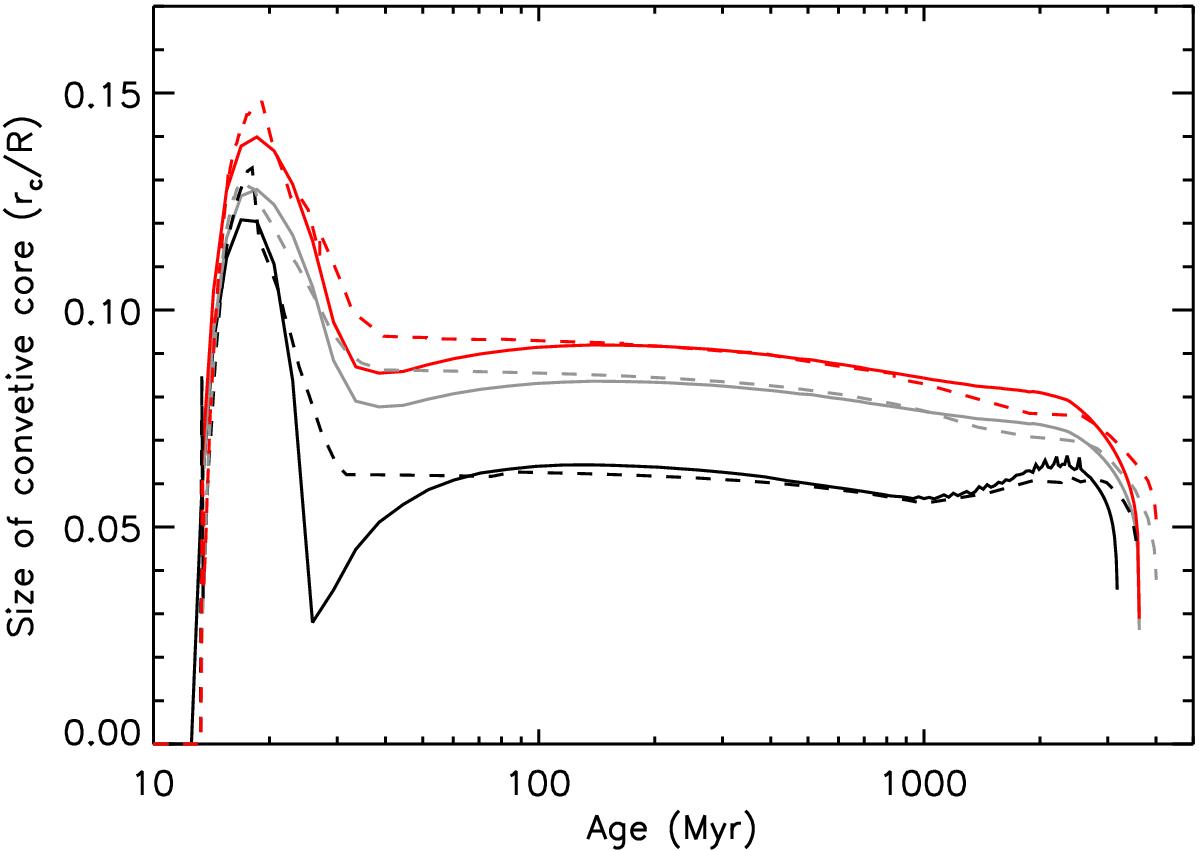
Variations in the size of the convective core with age for a 1.3 M⊙ model without overshooting (black lines) and with αov = 0.1 (red lines). The gray lines indicate the Schwarzschild limit for the case with overshooting. Cesam2k models are shown as solid lines, while mesa models are represented by dashed lines.
Current usage metrics show cumulative count of Article Views (full-text article views including HTML views, PDF and ePub downloads, according to the available data) and Abstracts Views on Vision4Press platform.
Data correspond to usage on the plateform after 2015. The current usage metrics is available 48-96 hours after online publication and is updated daily on week days.
Initial download of the metrics may take a while.