Free Access
Fig. 1
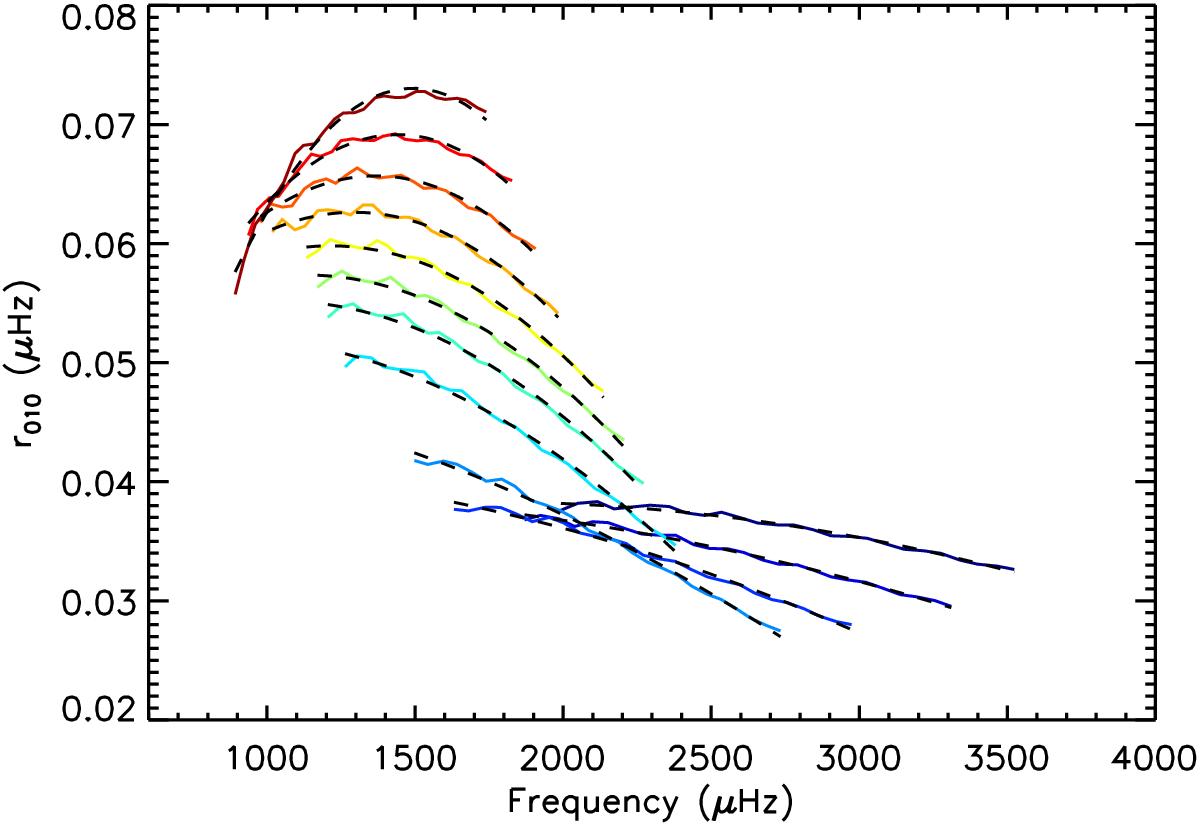
Variations in the ratio r010 around νmax as a function of frequency for models of 1.2 M⊙ from the ZAMS (dark blue) to the beginning of the post main sequence (dark red). The dashed lines correspond to fits of 2nd order polynomials.
Current usage metrics show cumulative count of Article Views (full-text article views including HTML views, PDF and ePub downloads, according to the available data) and Abstracts Views on Vision4Press platform.
Data correspond to usage on the plateform after 2015. The current usage metrics is available 48-96 hours after online publication and is updated daily on week days.
Initial download of the metrics may take a while.