Fig. 3
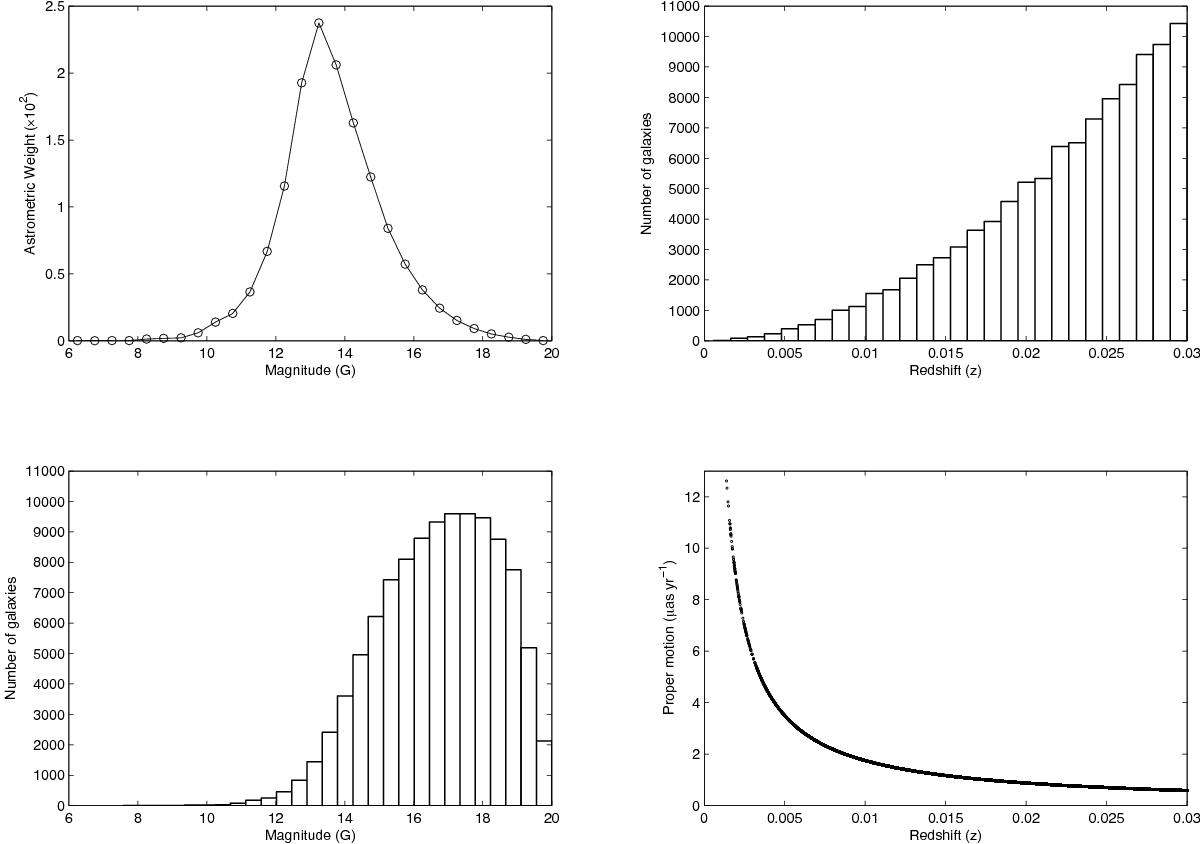
Left: astrometric weight (w) of GUMS galaxy
observations (see Hobbs et al. 2009), where
![]() , is the total statistical weight of
the assumed along-scan standard error of Gaia observations. Below
is the number of GUMS galaxies as a function of G magnitude.
The two left plots show that the highest astrometric weight is
from G =
12 to G = 16, but the number of galaxies peaks
around G =
17. Right: redshift distribution of the galaxies
from GUMS and the magnitude of the cosmological proper motion effect as a function
of redshift.
, is the total statistical weight of
the assumed along-scan standard error of Gaia observations. Below
is the number of GUMS galaxies as a function of G magnitude.
The two left plots show that the highest astrometric weight is
from G =
12 to G = 16, but the number of galaxies peaks
around G =
17. Right: redshift distribution of the galaxies
from GUMS and the magnitude of the cosmological proper motion effect as a function
of redshift.
Current usage metrics show cumulative count of Article Views (full-text article views including HTML views, PDF and ePub downloads, according to the available data) and Abstracts Views on Vision4Press platform.
Data correspond to usage on the plateform after 2015. The current usage metrics is available 48-96 hours after online publication and is updated daily on week days.
Initial download of the metrics may take a while.