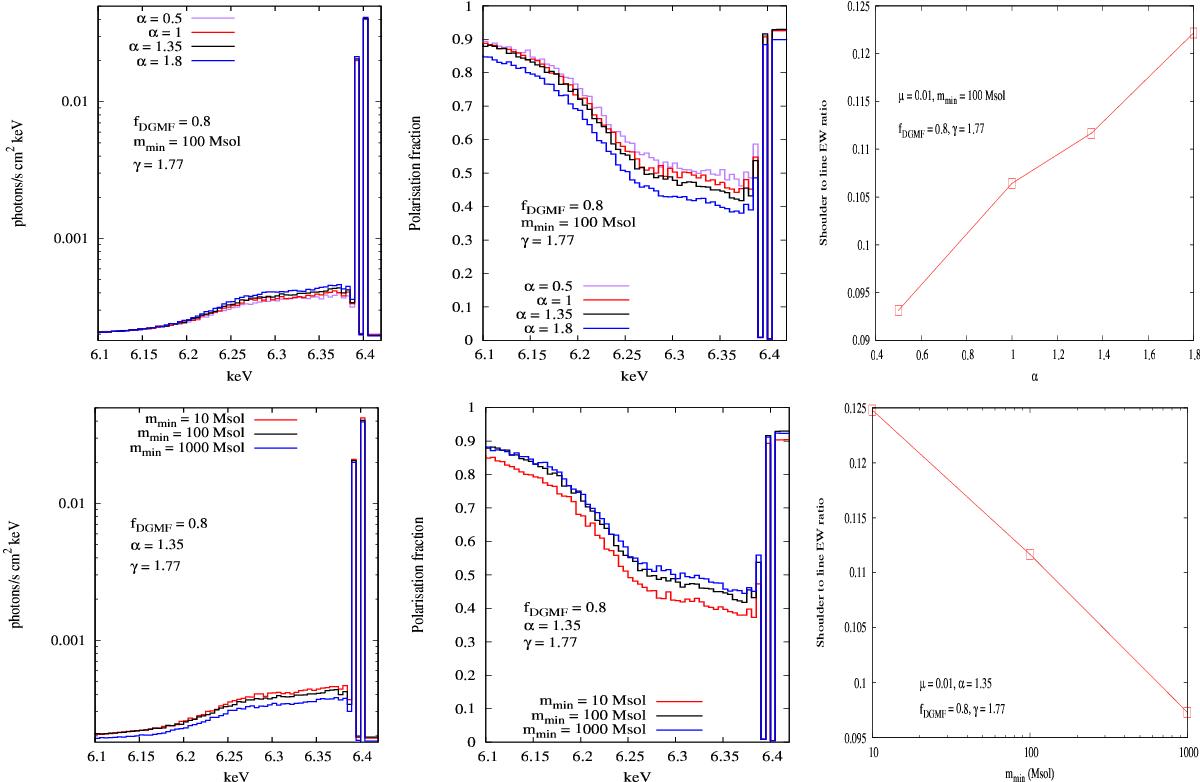
Fig. 8

Reflected energy (left plots) and polarisation (centre plots) around the 6.4 keV Fe K-α line (shown with resolution of 5 eV) and shoulder to line ratio (right plots) for varying α(top plots) and mmin(bottom plots) parameters at fixed μ = 0.01. Values of μ illustrated were obtained by adjusting the mnorm parameter in the mass-relation of clumps using Eq. (5). For increasing α, we expect an increase in the number of clumps being sampled from the higher mass range, resulting in a greater average size of the clumps in the population. In return, this results in an increase in the probability of X-rays intercepting them. Indeed, an increase in the Fe shoulder for increasing α is observed both in the energy and polarisation spectrum. The fragmentation of the clumps to lower and lower mmin, on the other hand, results in a larger projected area of the clump population, which increases the probability of interaction with incoming X-rays. This effect in also observed in the plots.
Current usage metrics show cumulative count of Article Views (full-text article views including HTML views, PDF and ePub downloads, according to the available data) and Abstracts Views on Vision4Press platform.
Data correspond to usage on the plateform after 2015. The current usage metrics is available 48-96 hours after online publication and is updated daily on week days.
Initial download of the metrics may take a while.


