Fig. 7
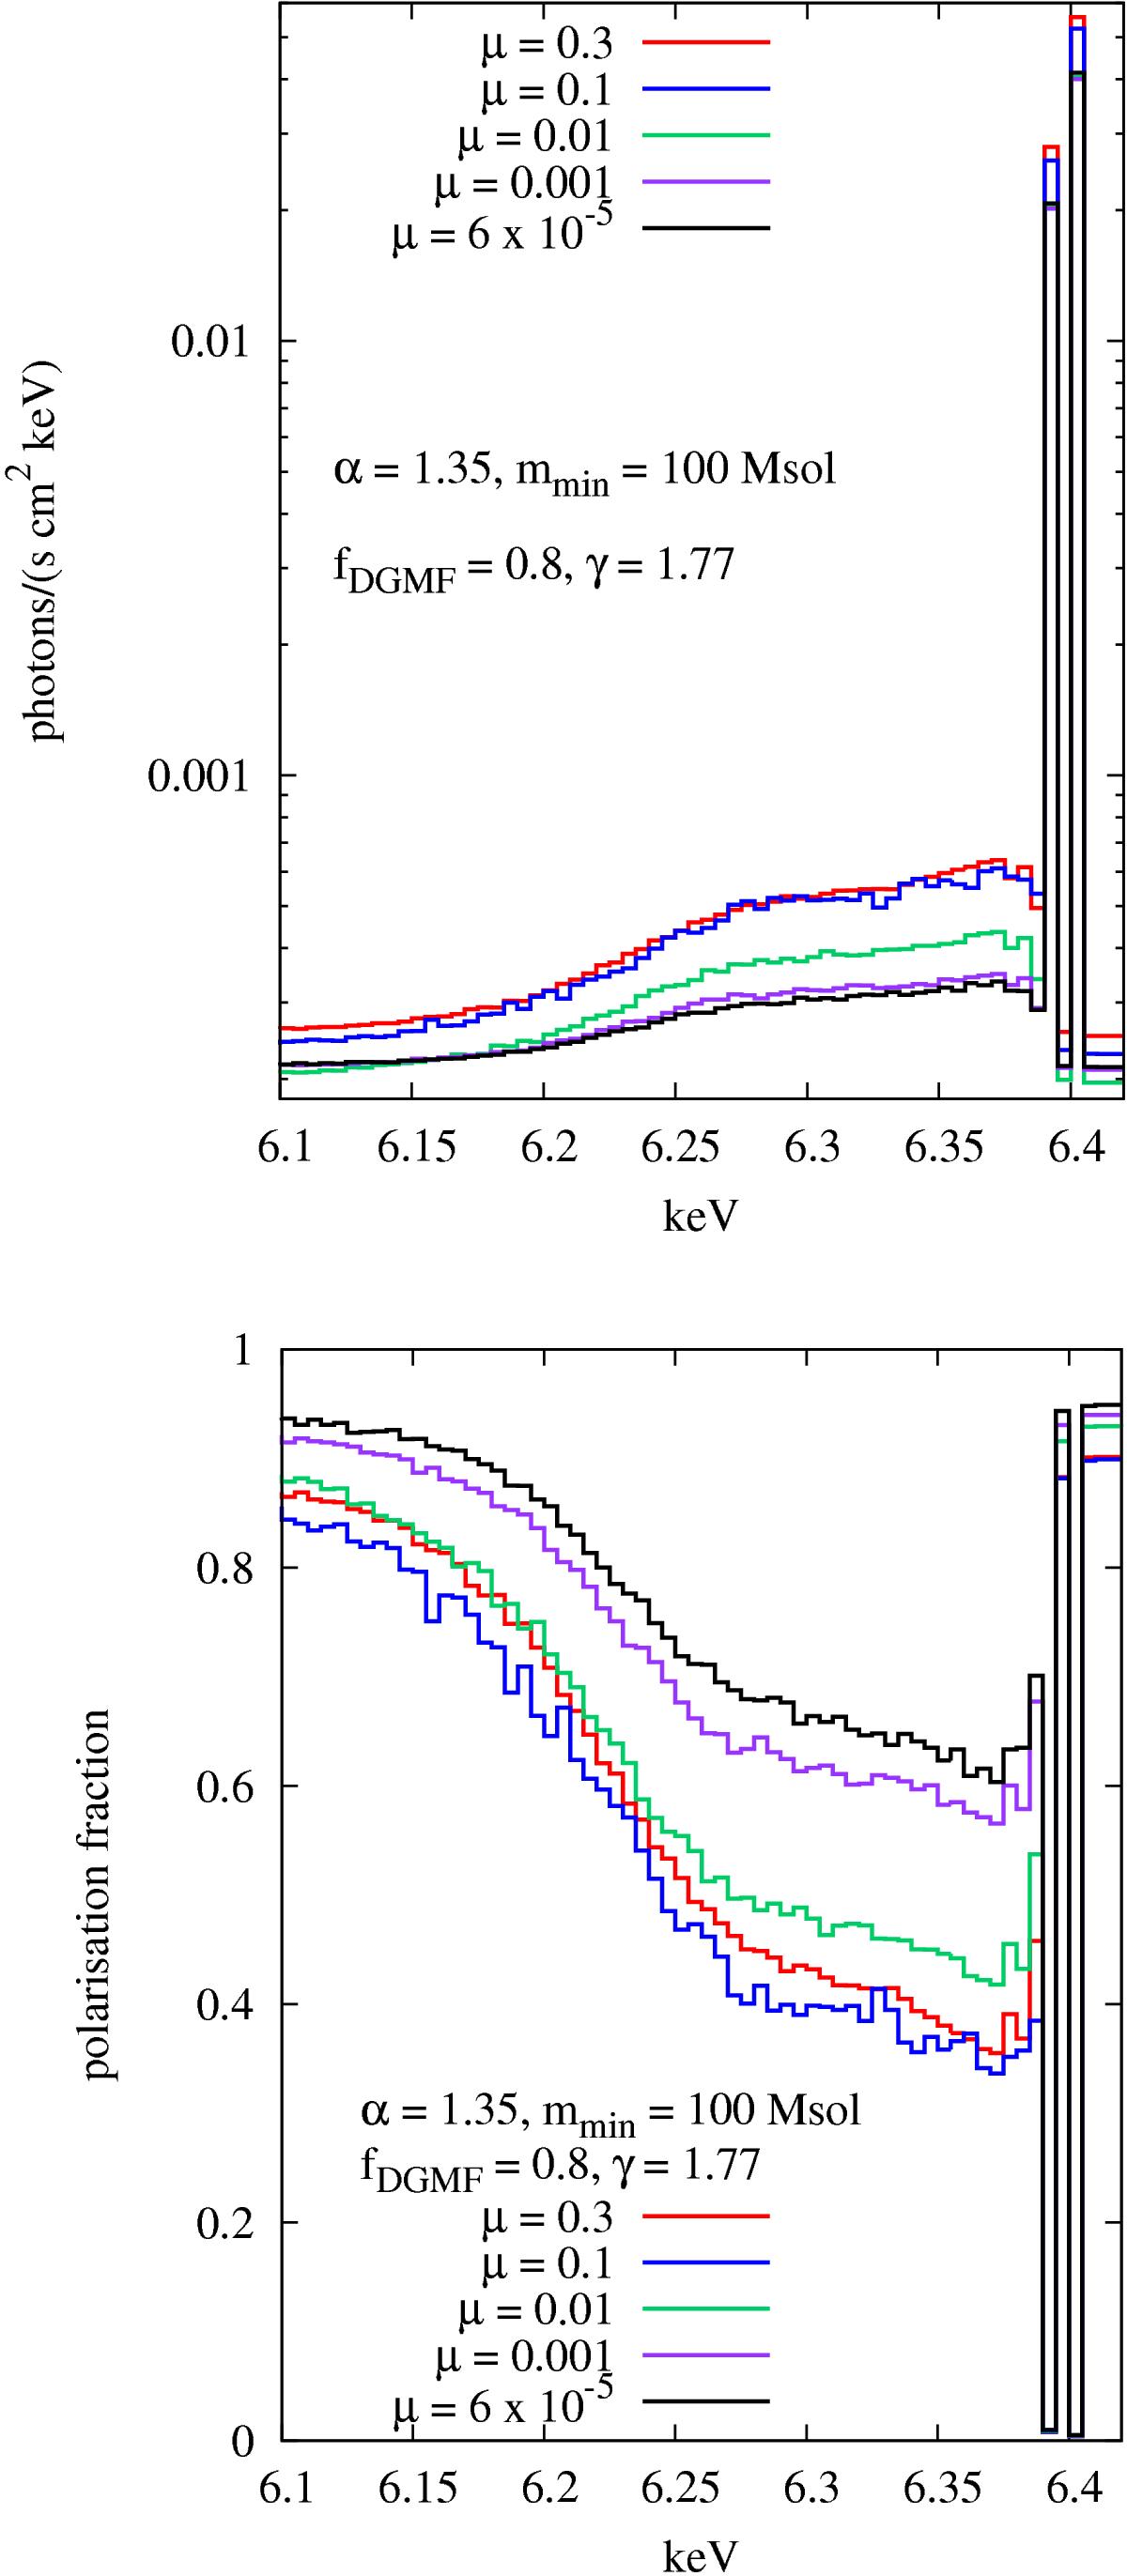
Reflected energy (top plot) and polarisation (bottom plot) around the 6.4 keV Fe K-α line for varying μ, shown with a resolution of 5 eV. The values of μ illustrated were obtained by adjusting the mnorm parameter in the mass-relation of clumps using Eq. (5). As expected, for increasingly large volume-filling factors, the probability of fluorescent photons intercepting the clumps increases, resulting in an increase in the shoulder’s flux. Note that, because the X-ray signal is really dependent on the projected area (see Sect. 3.1.4), which roughly goes as μ2 / 3, we would expect a volume-filling factor of μ ~ 0.001 (project area ~0.01) to already produce a visible signature in the X-ray spectrum. Indeed, from the polarisation fraction plot, it is clear that at μ = 0.001 the signal starts deviating from the virtually homogeneous case.
Current usage metrics show cumulative count of Article Views (full-text article views including HTML views, PDF and ePub downloads, according to the available data) and Abstracts Views on Vision4Press platform.
Data correspond to usage on the plateform after 2015. The current usage metrics is available 48-96 hours after online publication and is updated daily on week days.
Initial download of the metrics may take a while.