Fig. 3
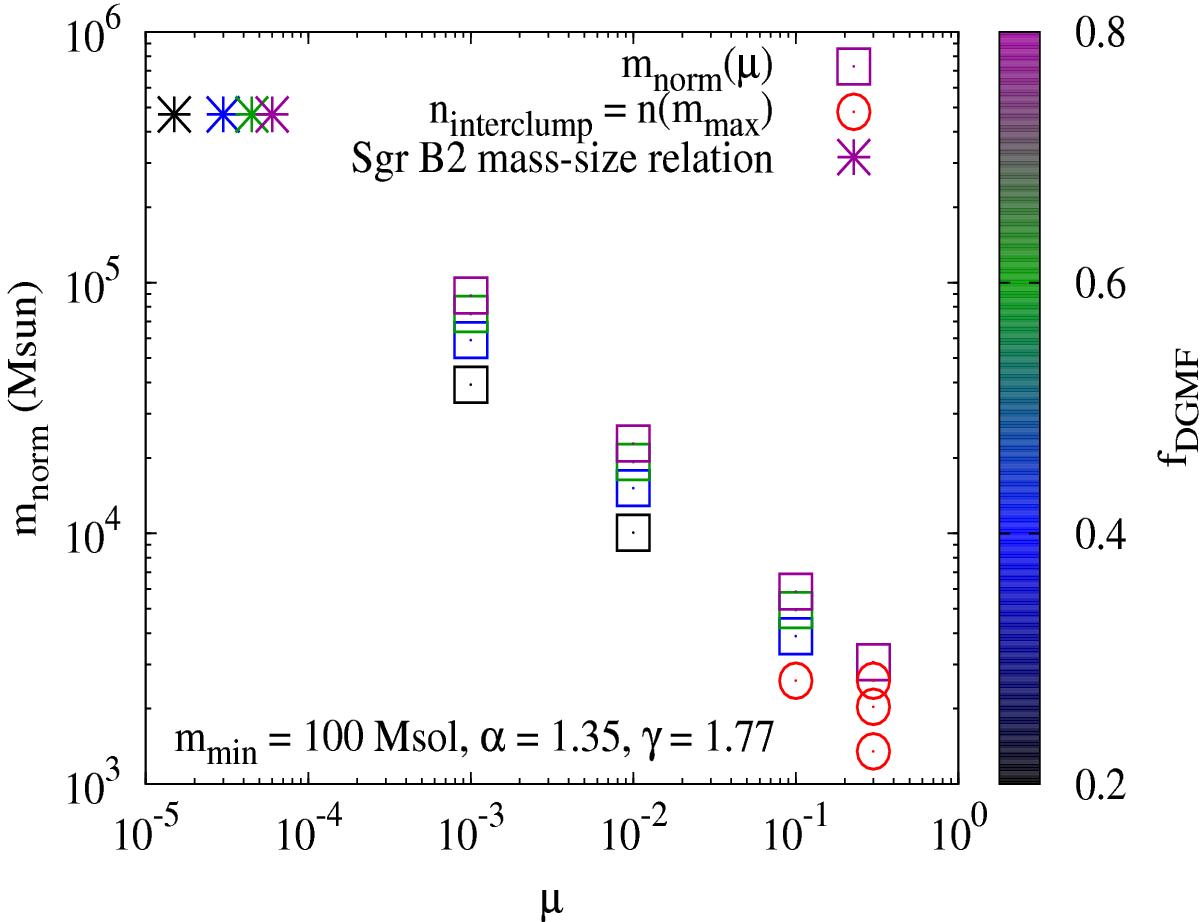
Normalisation parameter mnorm in the mass-size relation as a function of the volume-filling factor μ, calculated using Eq. (5), for different fDGMF at fixed α = 1.35, mmin = 100 M⊙ and γ = 1.77. We also show the μ values, obtained using the fixed Sgr B2 relation. Note that for high μ and low fDGMF values, we obtain mass-size relations yielding clump populations where the least dense clump, given by the clump with the highest mass (mmax), is less dense than the interclump density ninterclump, in contradiction with the very definition of a clump as an overdensity; we clearly indicated these models in red in the plot. We will use the fDGMF value that allows us to explore a widest possible range of μ, fDGMF = 0.8, to investigate the impact of increasing μ on the reflected X-ray signal (see Fig. 7).
Current usage metrics show cumulative count of Article Views (full-text article views including HTML views, PDF and ePub downloads, according to the available data) and Abstracts Views on Vision4Press platform.
Data correspond to usage on the plateform after 2015. The current usage metrics is available 48-96 hours after online publication and is updated daily on week days.
Initial download of the metrics may take a while.