Fig. 2
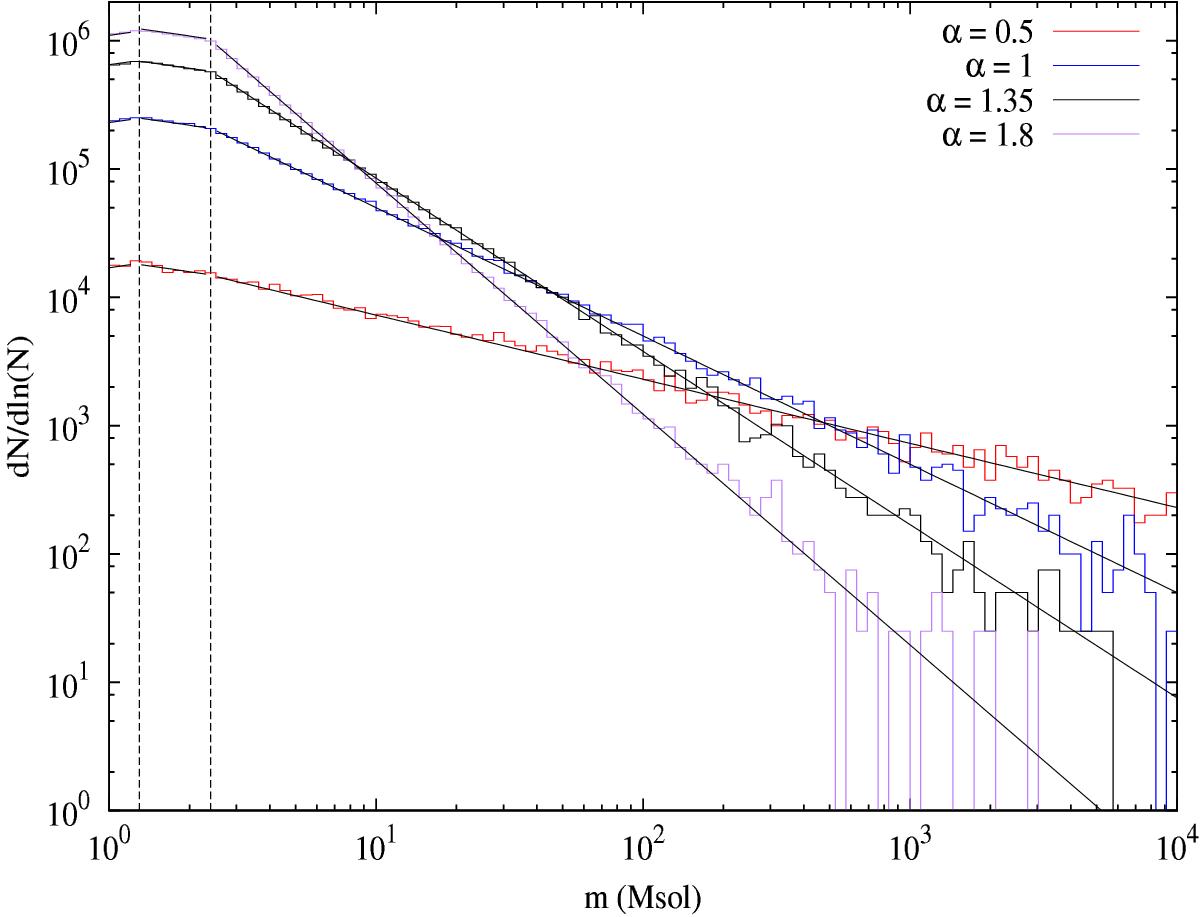
Clump mass functions for different α with fDGMF = 0.4. The grey solid lines show the distributions sampled, while the coloured lines show the actual realisation. The vertical lines show the values at which the CMF changes in slope. As the slope of the function steepens, more clumps are selected from the lower-mass range. This leads to a progressive increase in the numerical noise in the sampled population at higher masses with increasing α, as seen in the plot.
Current usage metrics show cumulative count of Article Views (full-text article views including HTML views, PDF and ePub downloads, according to the available data) and Abstracts Views on Vision4Press platform.
Data correspond to usage on the plateform after 2015. The current usage metrics is available 48-96 hours after online publication and is updated daily on week days.
Initial download of the metrics may take a while.