Fig. 14
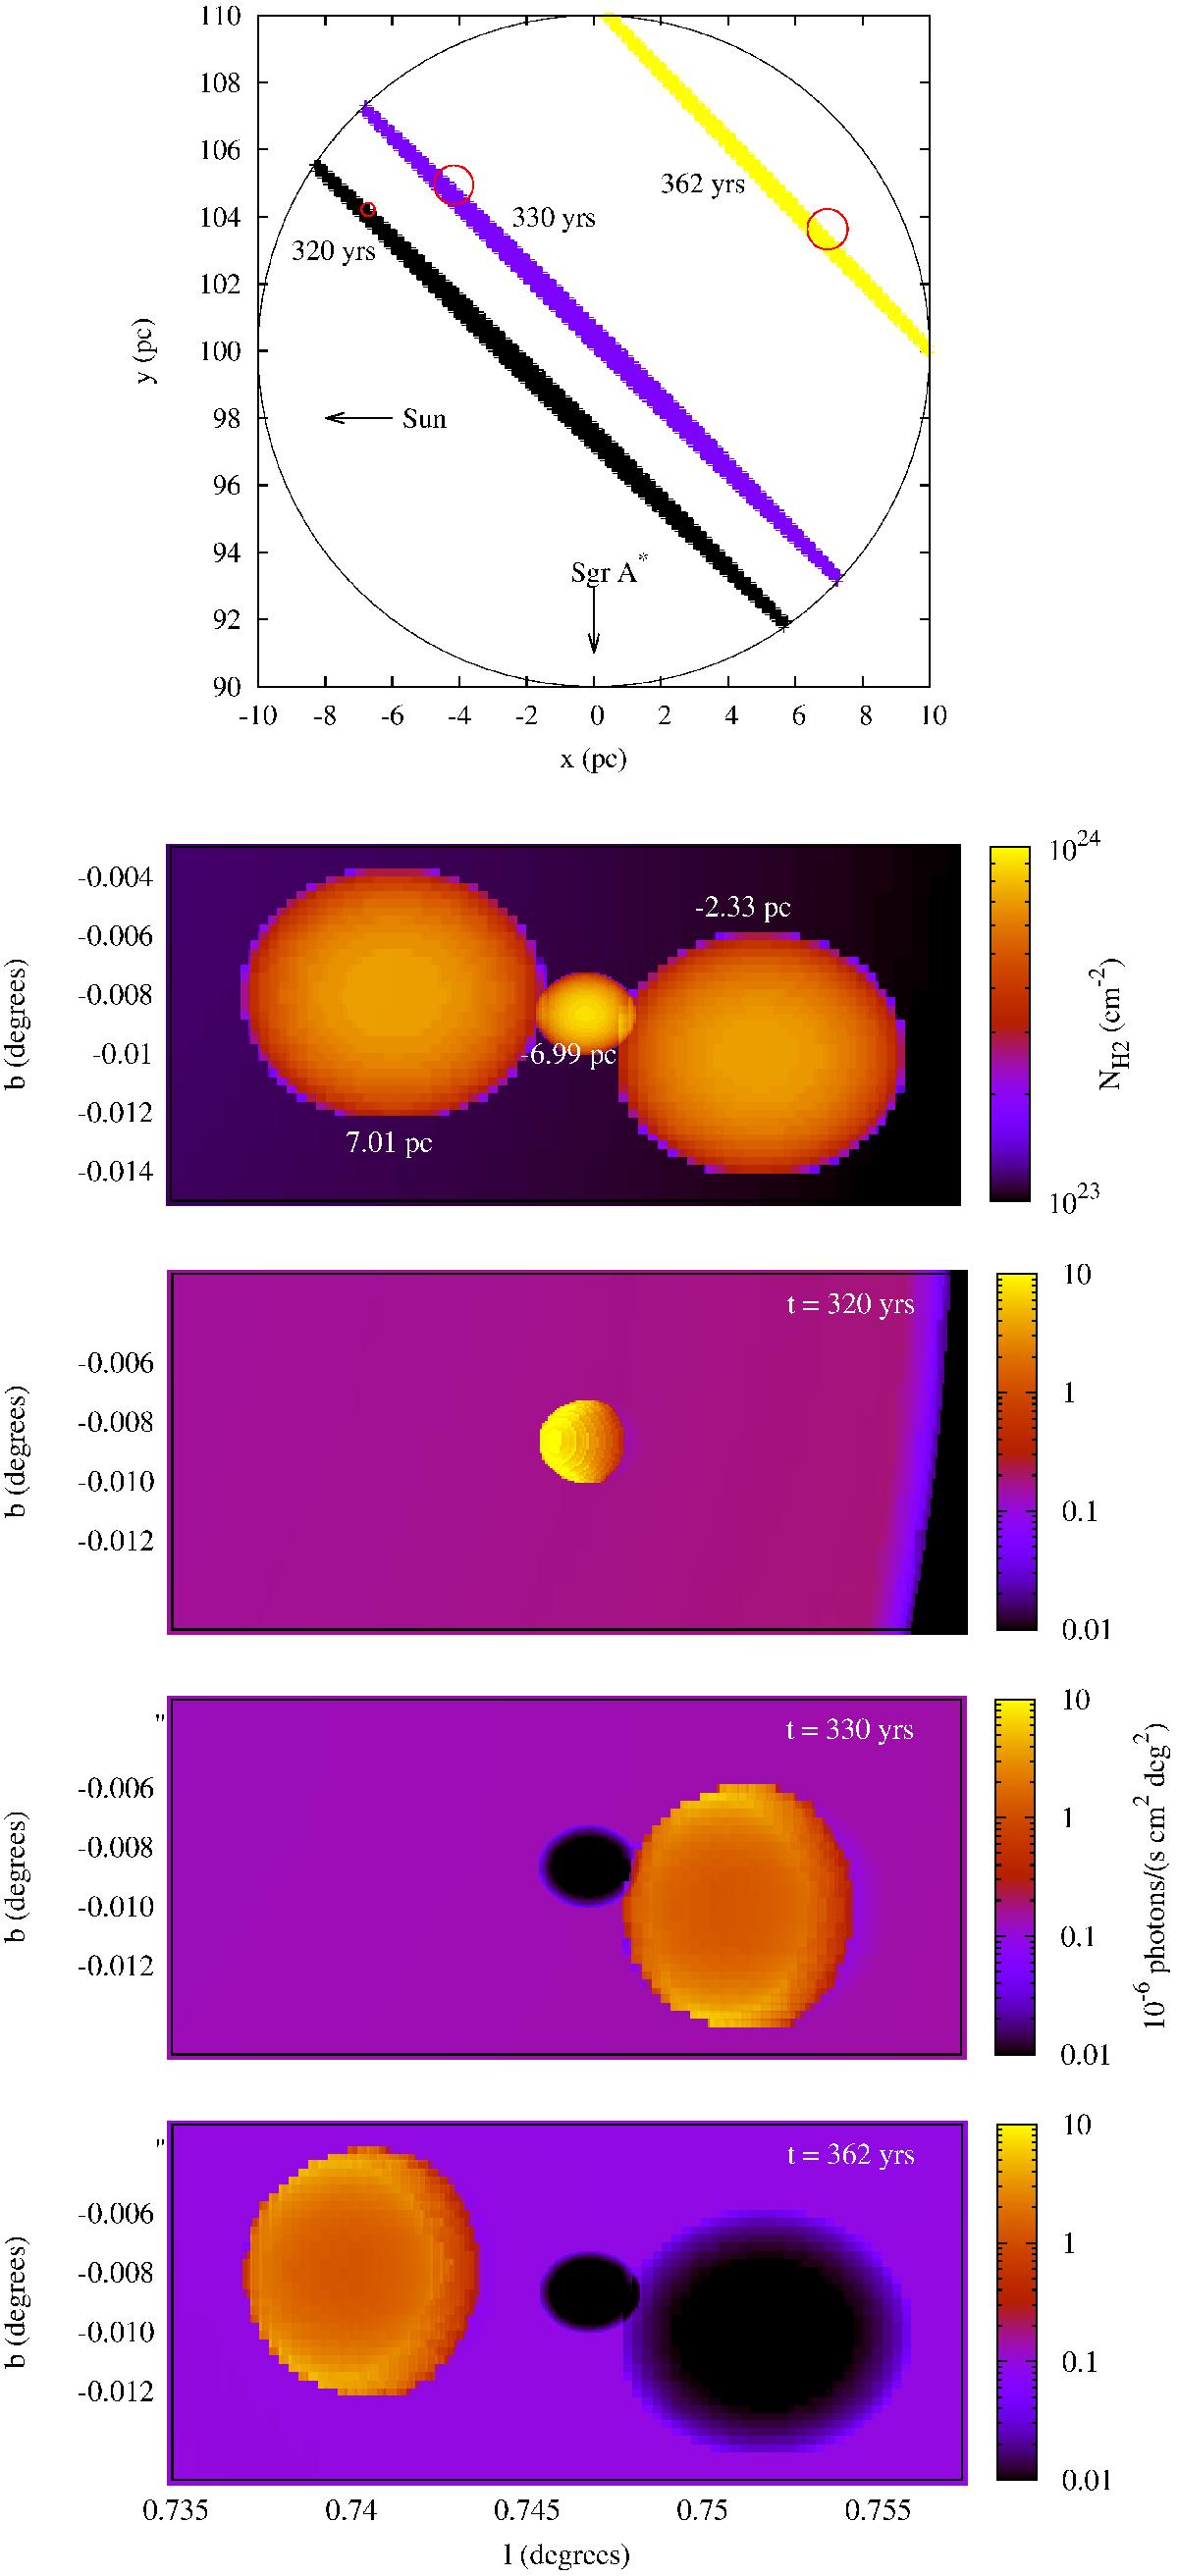
Top plot: projected location of the clumps inside Sgr B2 and regions inside Sgr B2 visible to the observer at times when the substructures should become visible (assuming illumination by an instantaneous flare). Second plot: column density map of three simulated clumps within Sgr B2, found in a small region of the sky (labels in plot indicate the clumps’ distance from the centre of the cloud, approximated as D − DSgrB2). Third, fourth and fifth plots: reflected X-ray intensity reaching the observer at different times. Despite the apparent proximity of the clumps on the sky, because of the different distance at which they are located along the line of sight, the clumps are visible through their reflected X-ray emission at different times, so that when one is visible, the others are not.
Current usage metrics show cumulative count of Article Views (full-text article views including HTML views, PDF and ePub downloads, according to the available data) and Abstracts Views on Vision4Press platform.
Data correspond to usage on the plateform after 2015. The current usage metrics is available 48-96 hours after online publication and is updated daily on week days.
Initial download of the metrics may take a while.