Fig. 13
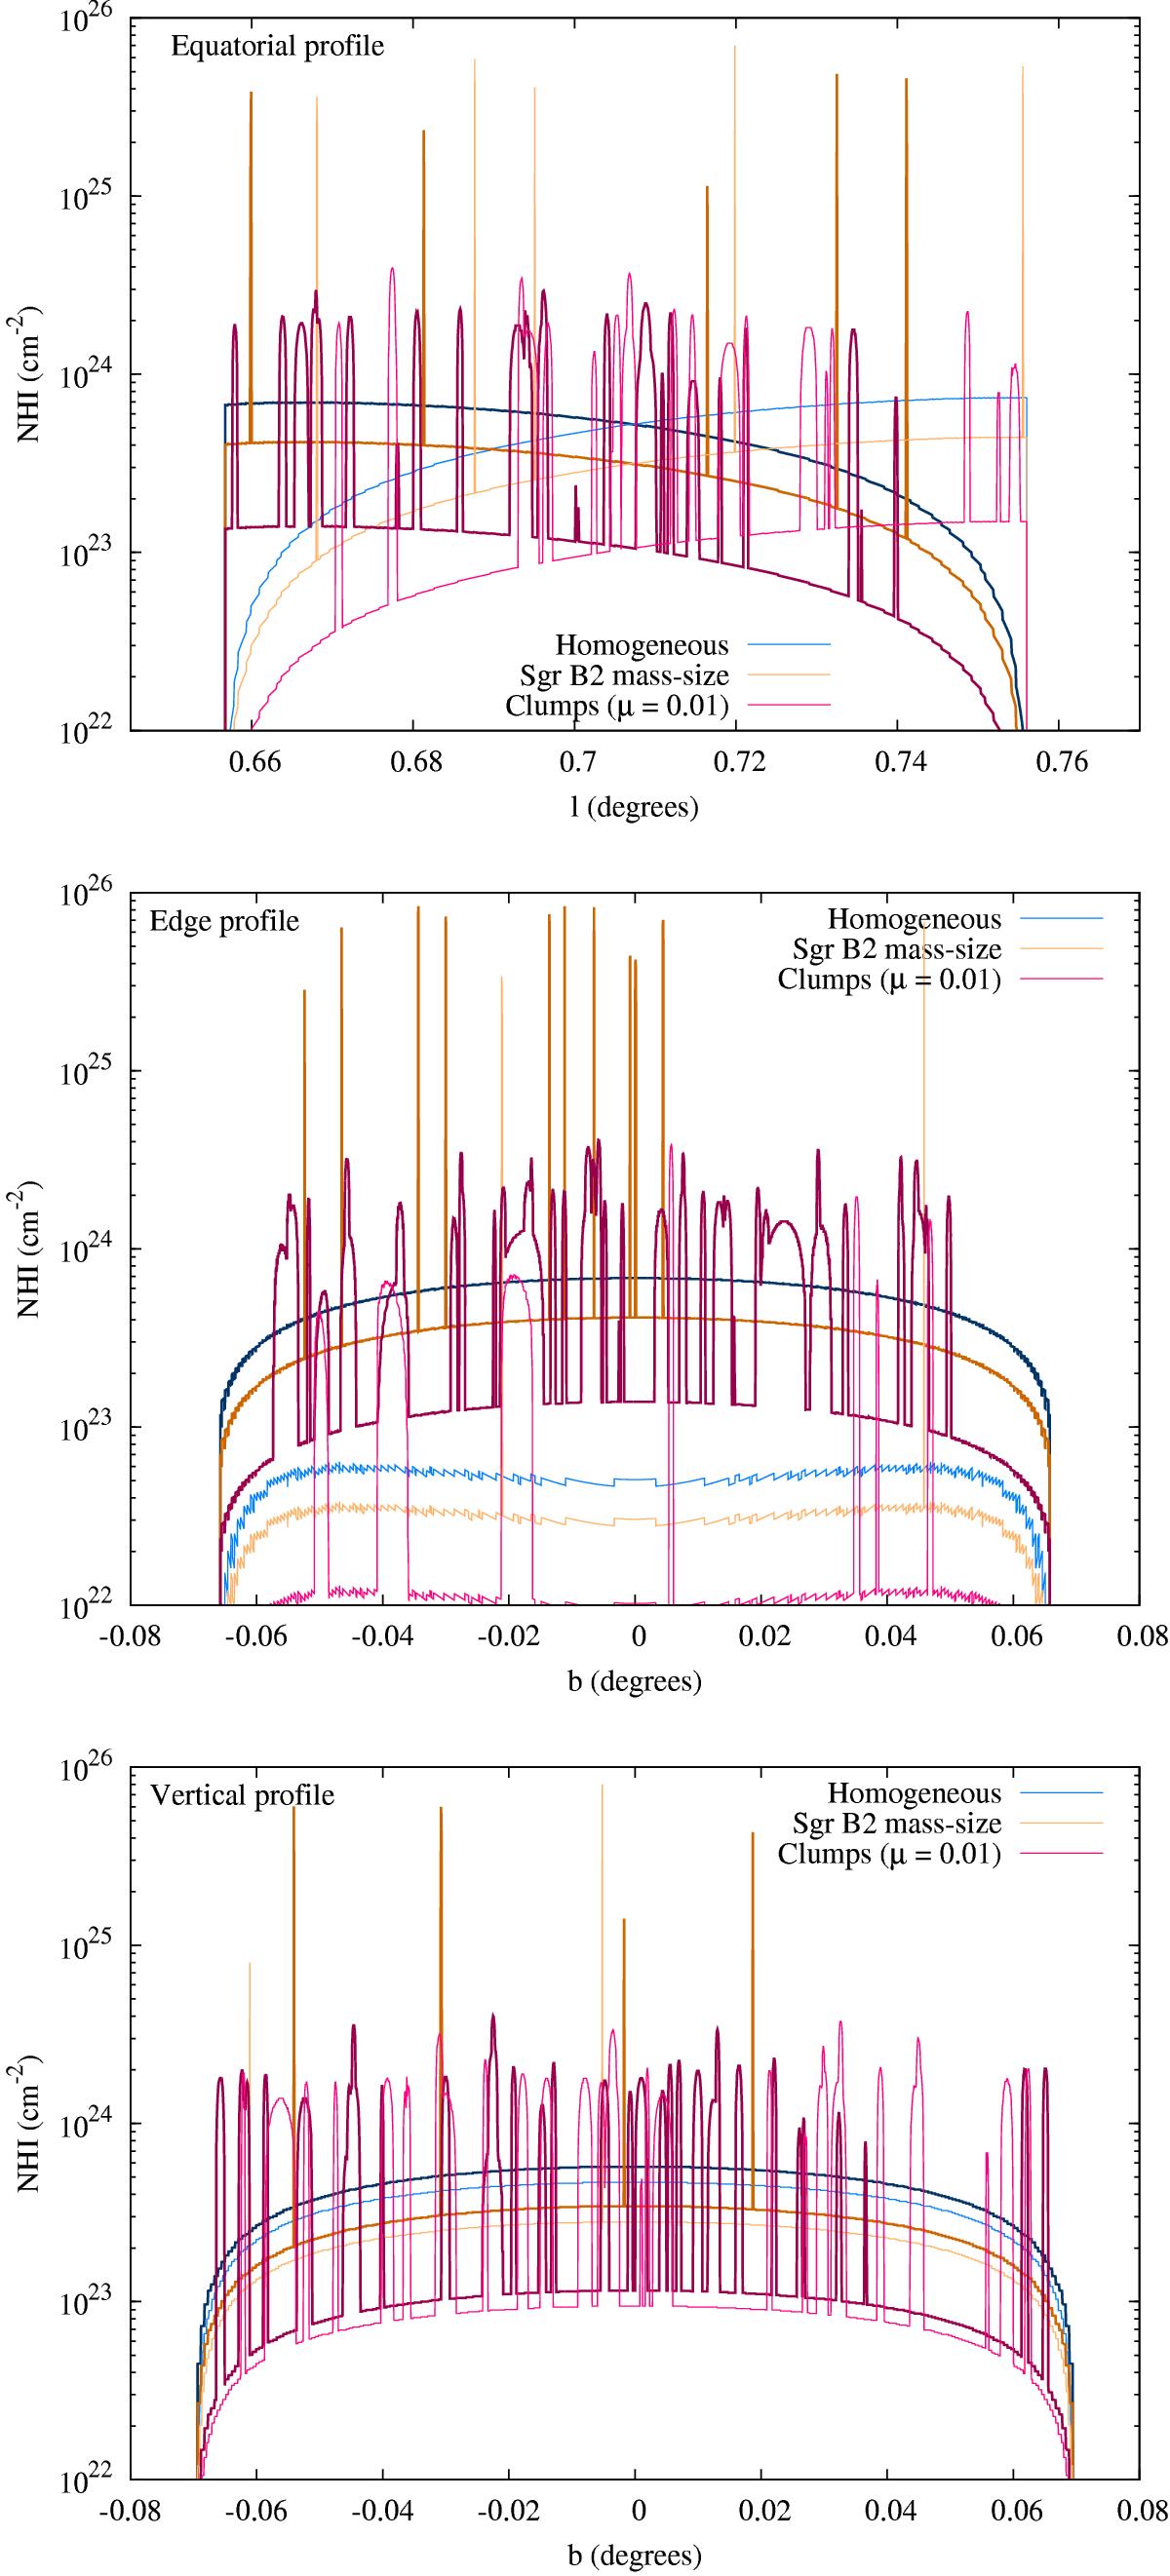
Column density from the source to the point of scattering (darker colours) and from the point of scattering to the observer (lighter colours) along profiles indicated in Fig. 11, excluding the contribution of the diffuse envelope. The plots show the case of minimum column density (t′ = 0) at time t = 320 yrs. The different mass-size relations assumed in clump models “Sgr B2 mass-size” and “μ = 0.01” result in the latter case presenting: a higher probability of intercepting clumps, broader absorption features in the intensity profiles, and lower column density peaks.
Current usage metrics show cumulative count of Article Views (full-text article views including HTML views, PDF and ePub downloads, according to the available data) and Abstracts Views on Vision4Press platform.
Data correspond to usage on the plateform after 2015. The current usage metrics is available 48-96 hours after online publication and is updated daily on week days.
Initial download of the metrics may take a while.