Fig. 11
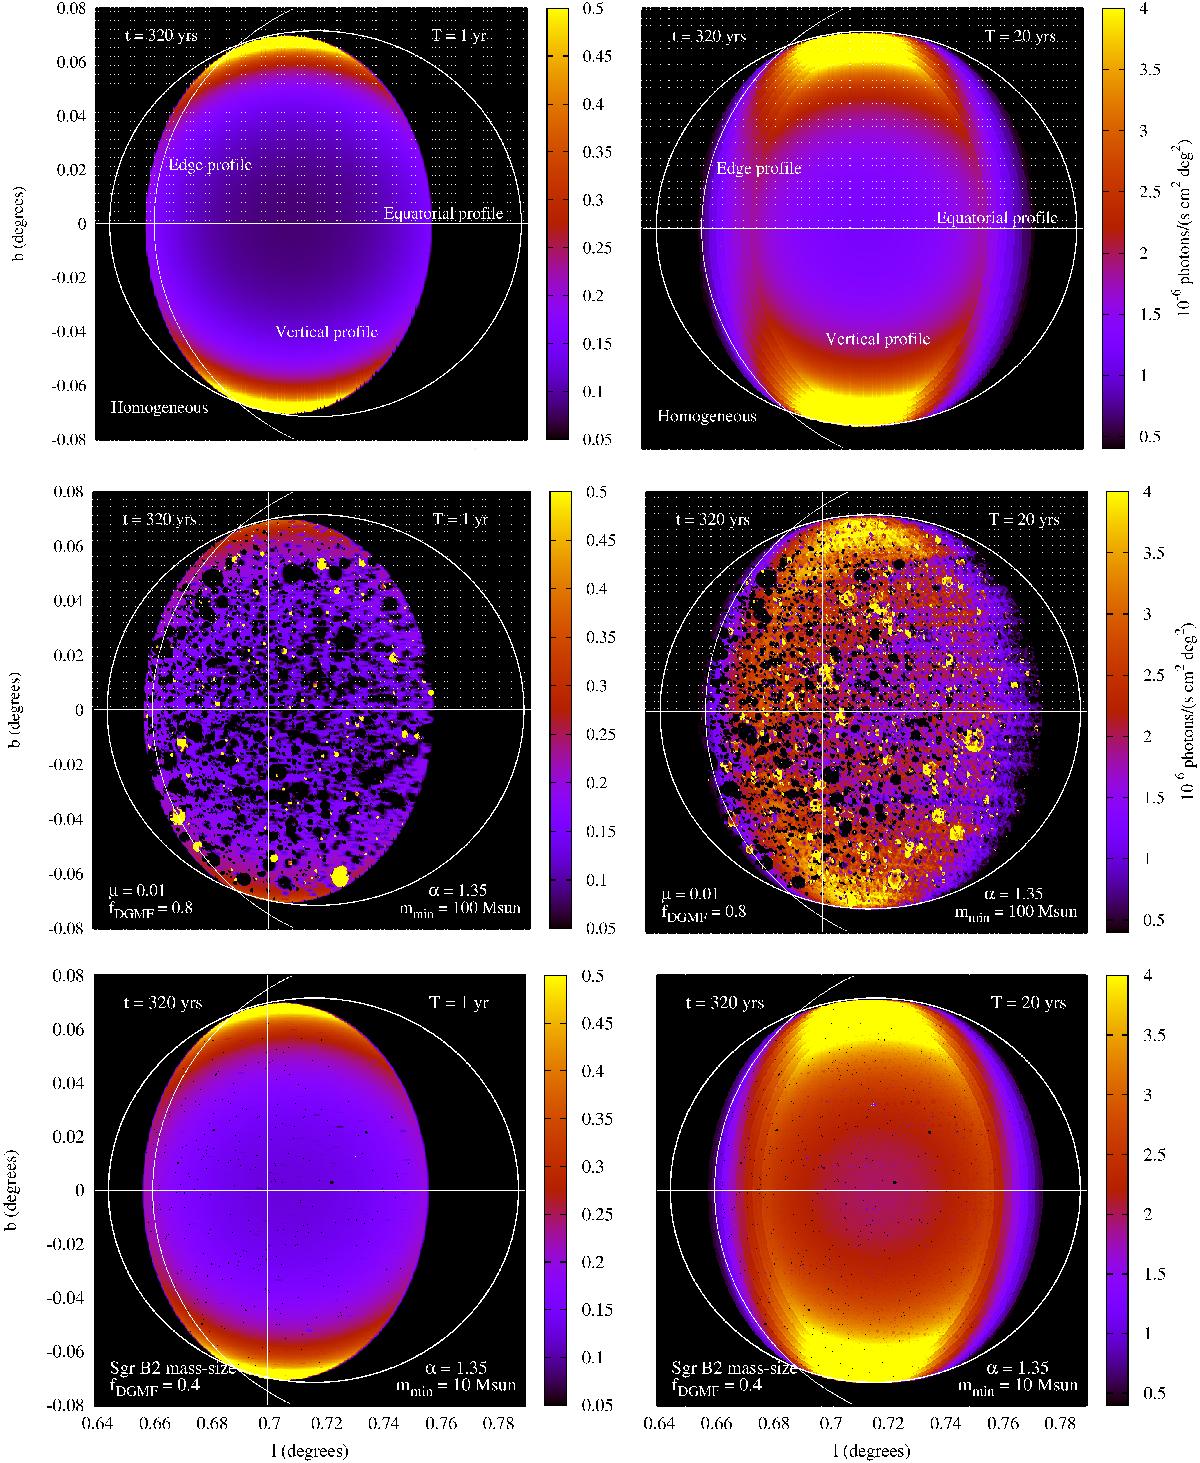
Analytic, single scattering approximation of the 3–20 keV reflected X-ray intensity observed at time t = 320 yr for the three cloud models, discussed in the text, and for the case of a short (1 yr) and long (20 yr) flare. The source, located at l = 0°,b = 0°, illuminates the cloud from the left side in the above plots. The angular resolution used is of 1 arcsec. The intensity and column density profiles for the equatorial, vertical, and edge profiles indicated in the maps are shown in Figs. 12 and 13, respectively.
Current usage metrics show cumulative count of Article Views (full-text article views including HTML views, PDF and ePub downloads, according to the available data) and Abstracts Views on Vision4Press platform.
Data correspond to usage on the plateform after 2015. The current usage metrics is available 48-96 hours after online publication and is updated daily on week days.
Initial download of the metrics may take a while.