Fig. 10
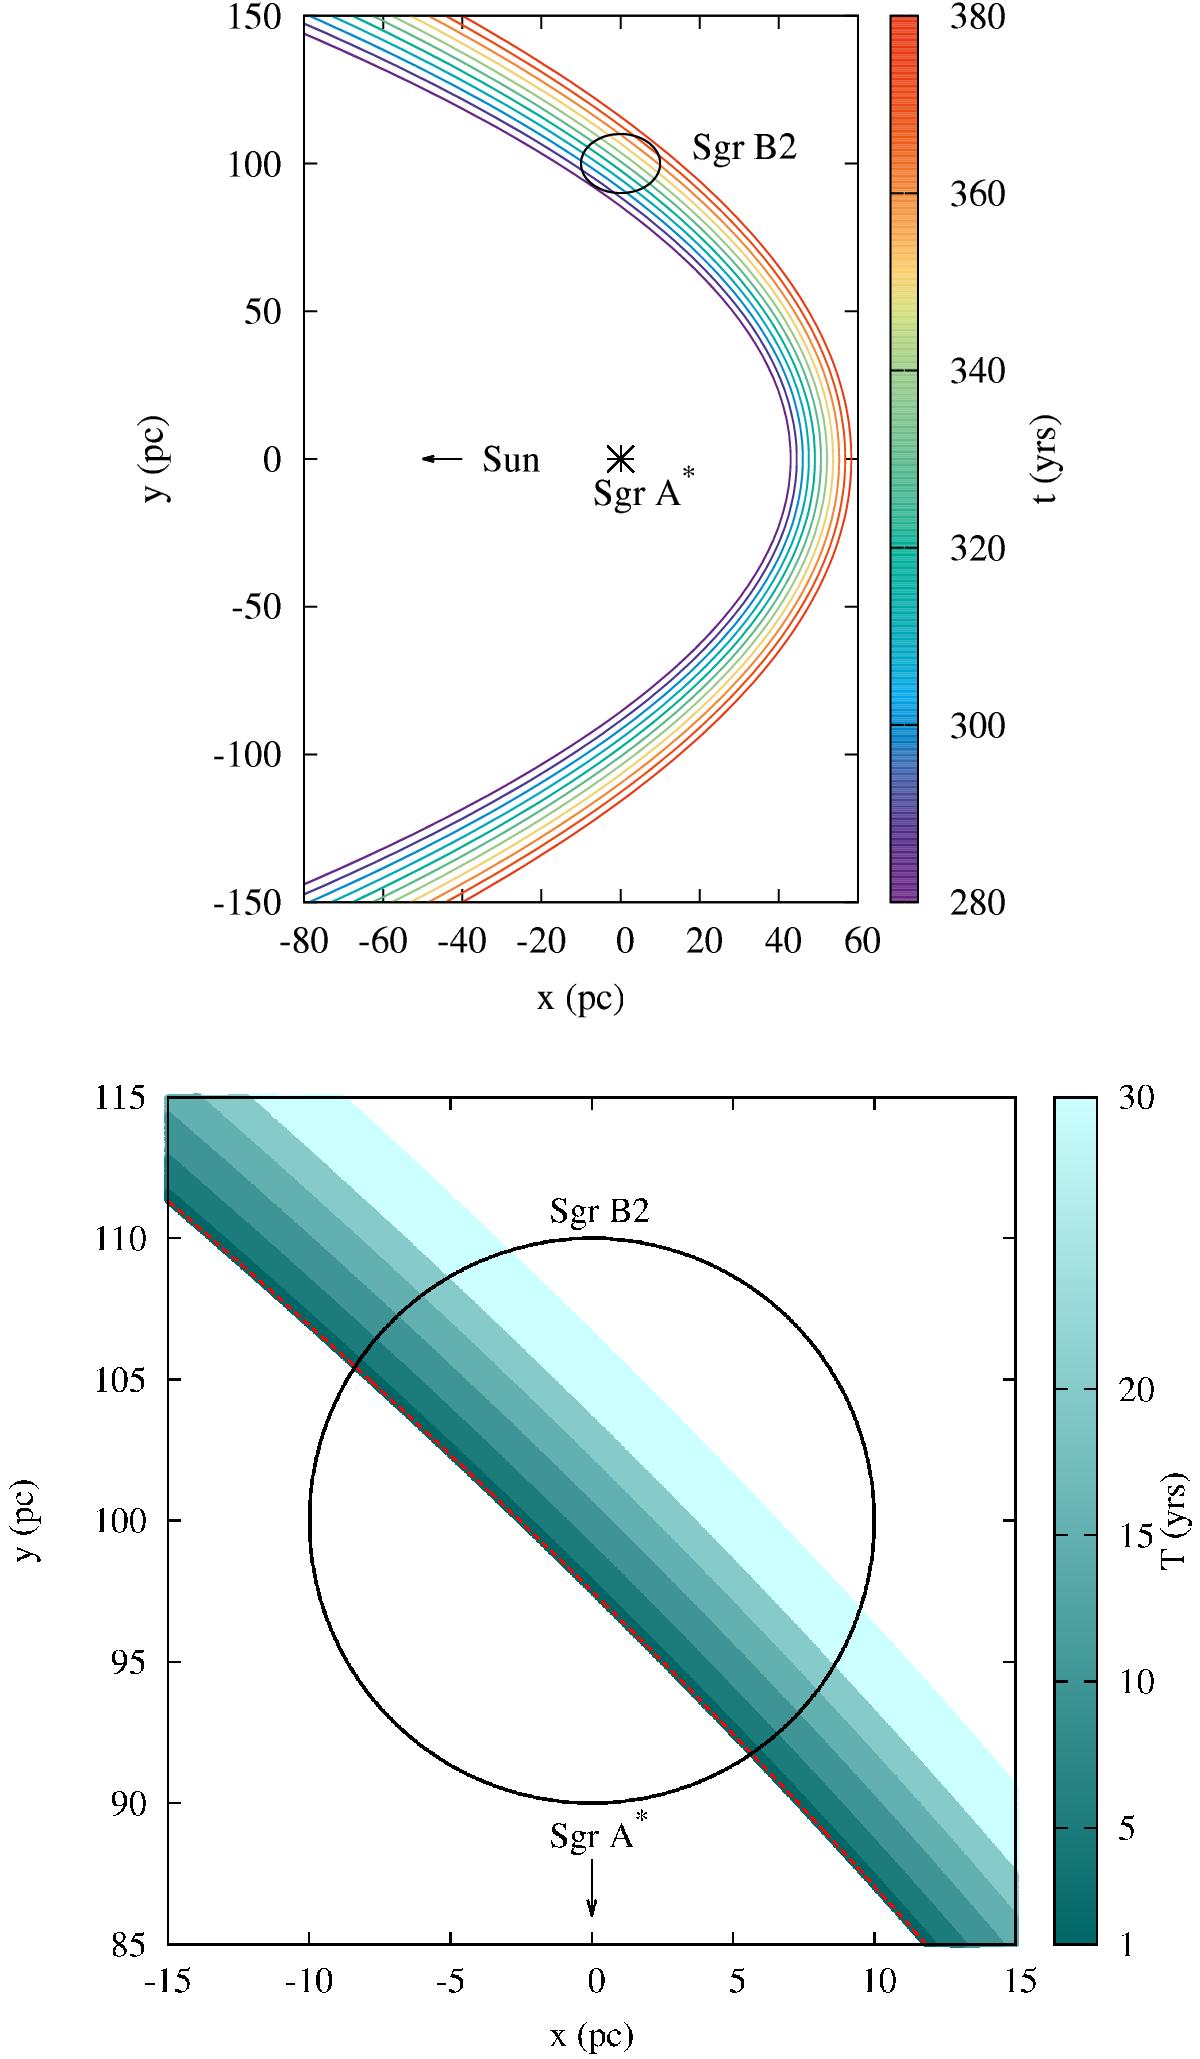
Top plot: regions of the x-y plane visible to the observer at different times through scattered X-ray photons, in the case of photons originally emitted by an instantaneous flare of Sgr A∗ (i.e. all photons emitted at t = 0). Bottom plot: regions of the x-y plane visible to the observer through scattered X-rays at time t = 320 yr, in the case of an instantaneous flare (dashed line) and in the case of flares of duration T (coloured maps). The longer the duration of the flare, the thicker the region of the sky observable simultaneously.
Current usage metrics show cumulative count of Article Views (full-text article views including HTML views, PDF and ePub downloads, according to the available data) and Abstracts Views on Vision4Press platform.
Data correspond to usage on the plateform after 2015. The current usage metrics is available 48-96 hours after online publication and is updated daily on week days.
Initial download of the metrics may take a while.