Fig. 8
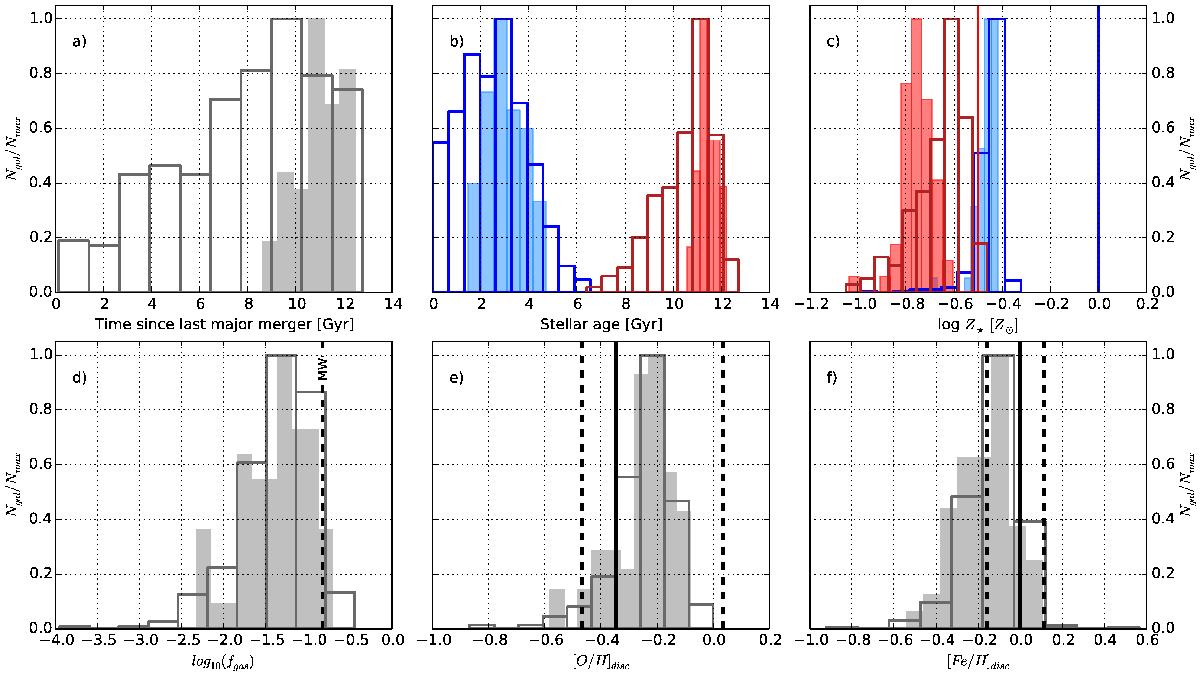
Global properties for our Milky Way-like galaxy samples. Each histogram is normalised to the maximum number of objects contained in a bin. In each panel, the filled and empty histograms are dedicated to our MW-sisters sample and MW-cousins sample, respectively. Panel a) time since the last major merger. Panel b) luminosity-weighted age of the disk (blue) and the bulge (red) stellar populations. Panel c) luminosity-weighted stellar metallicity of the disk (blue histogram) and bulge (red histogram). Our results are compared to Bensby et al. (2014) (blue vertical line) for the stellar population of the disc and to Bensby et al. (2013) (red vertical line) for the stellar population of the bulge. Panel d): gas fraction; the dark vertical line indicates the gas fraction measured in the Milky Way by Yin et al. (2009). Panel e) oxygen abundance [O / H] disk in the gas phase of the disk. Our predictions are compared to a compilation of oxygen abundances measured in recently formed open clusters (Balser et al. 2011; Maderak et al. 2013). Panel f) iron abundance [Fe / H] disk in the gas-phase of the disk. Our predictions are compared to a compilation of iron abundances measured in recently formed open clusters (Pancino et al. 2010; Maderak et al. 2013). In panels e) and f), the solid vertical black line and the two dashed vertical black lines represent the median, first, and third quartile of the data compilations, respectively.
Current usage metrics show cumulative count of Article Views (full-text article views including HTML views, PDF and ePub downloads, according to the available data) and Abstracts Views on Vision4Press platform.
Data correspond to usage on the plateform after 2015. The current usage metrics is available 48-96 hours after online publication and is updated daily on week days.
Initial download of the metrics may take a while.