Fig. 7
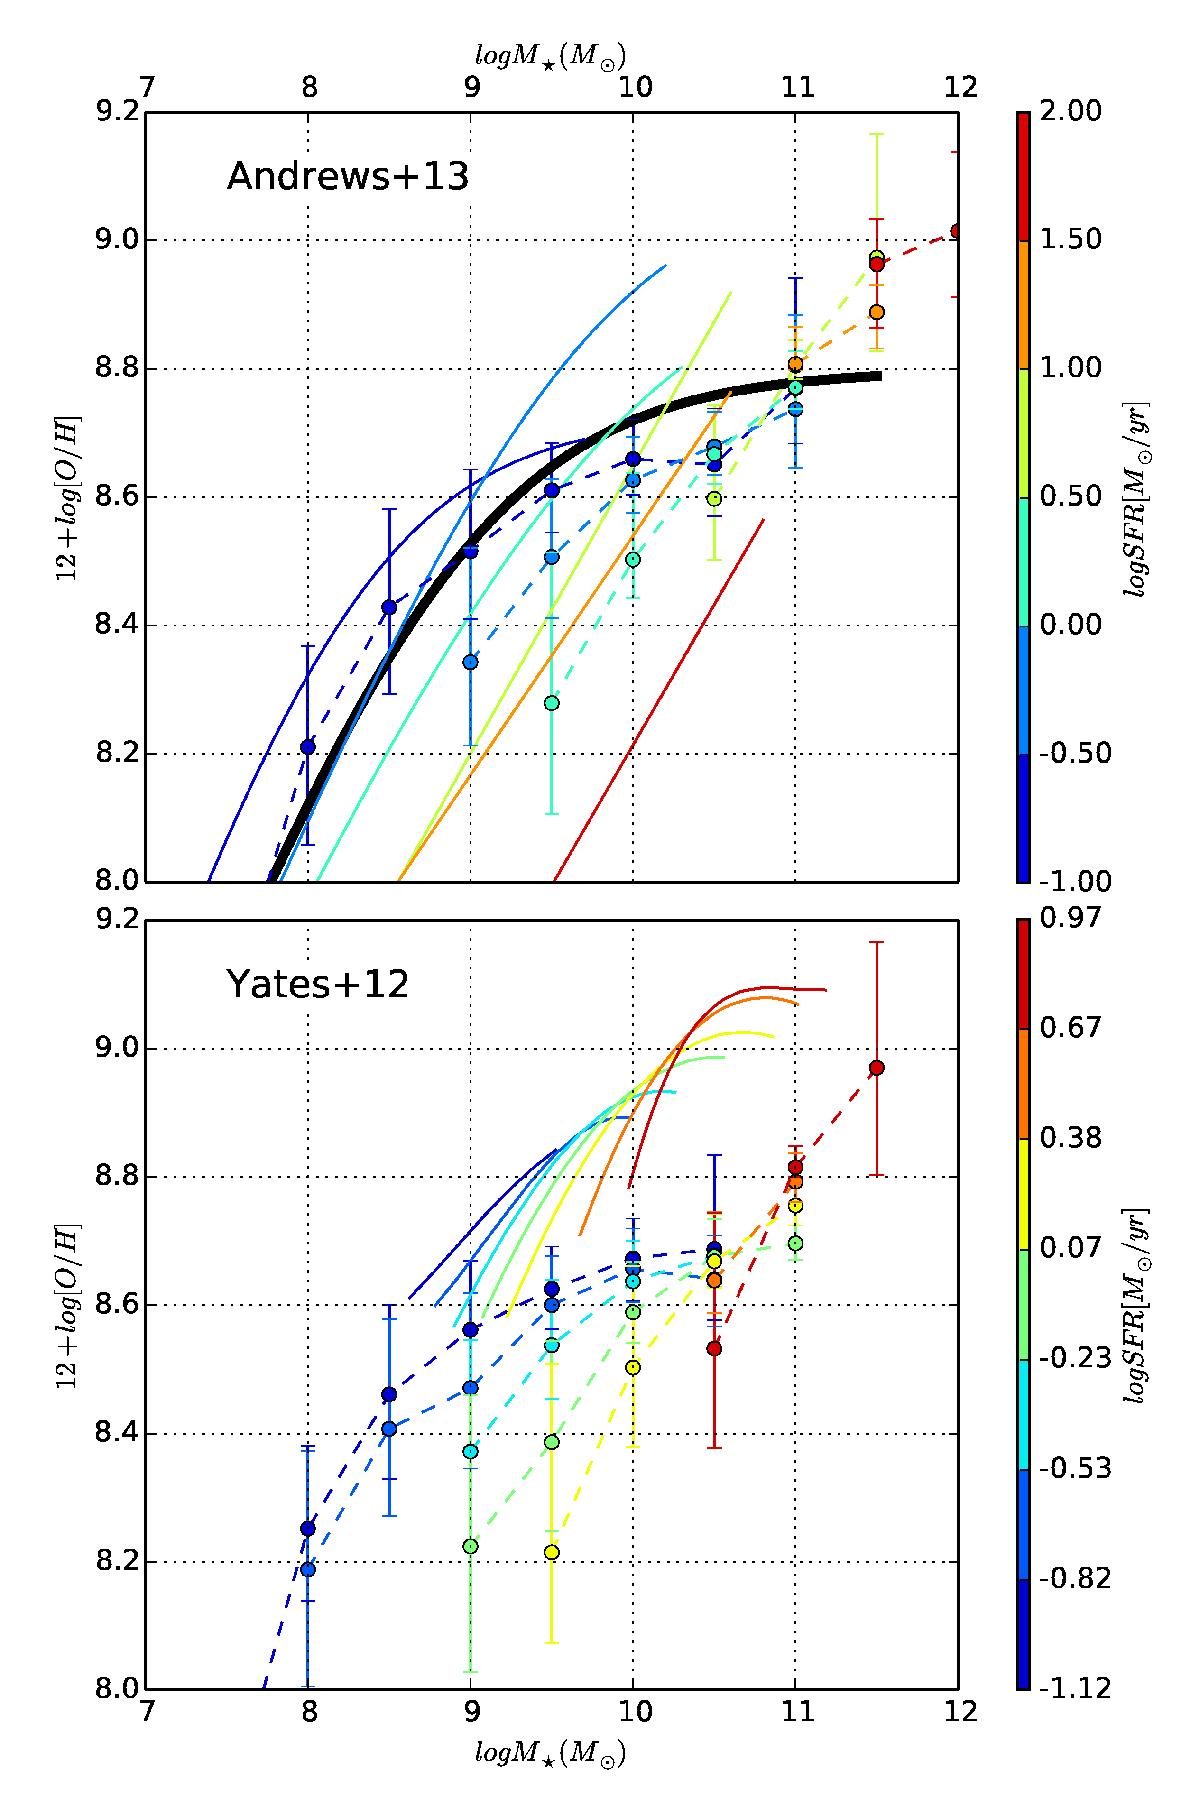
SFR to M⋆ − Zg relation. Our best-model m3 is compared to observational results from Andrews & Martini (2013) (upper panel) and Yates et al. (2012) (bottom panel). In both cases, the original metallicity bins were respected. Solid lines show the observational results. The colour scale represents the SFR bin. The circles with error bars, connected by dashed lines, correspond to the median trend of our models. Error bars are computed using the first and third quartile of the distribution. In the upper panel, the solid black line represents the median trend of the − M⋆ − Zg relation.
Current usage metrics show cumulative count of Article Views (full-text article views including HTML views, PDF and ePub downloads, according to the available data) and Abstracts Views on Vision4Press platform.
Data correspond to usage on the plateform after 2015. The current usage metrics is available 48-96 hours after online publication and is updated daily on week days.
Initial download of the metrics may take a while.