Fig. 6
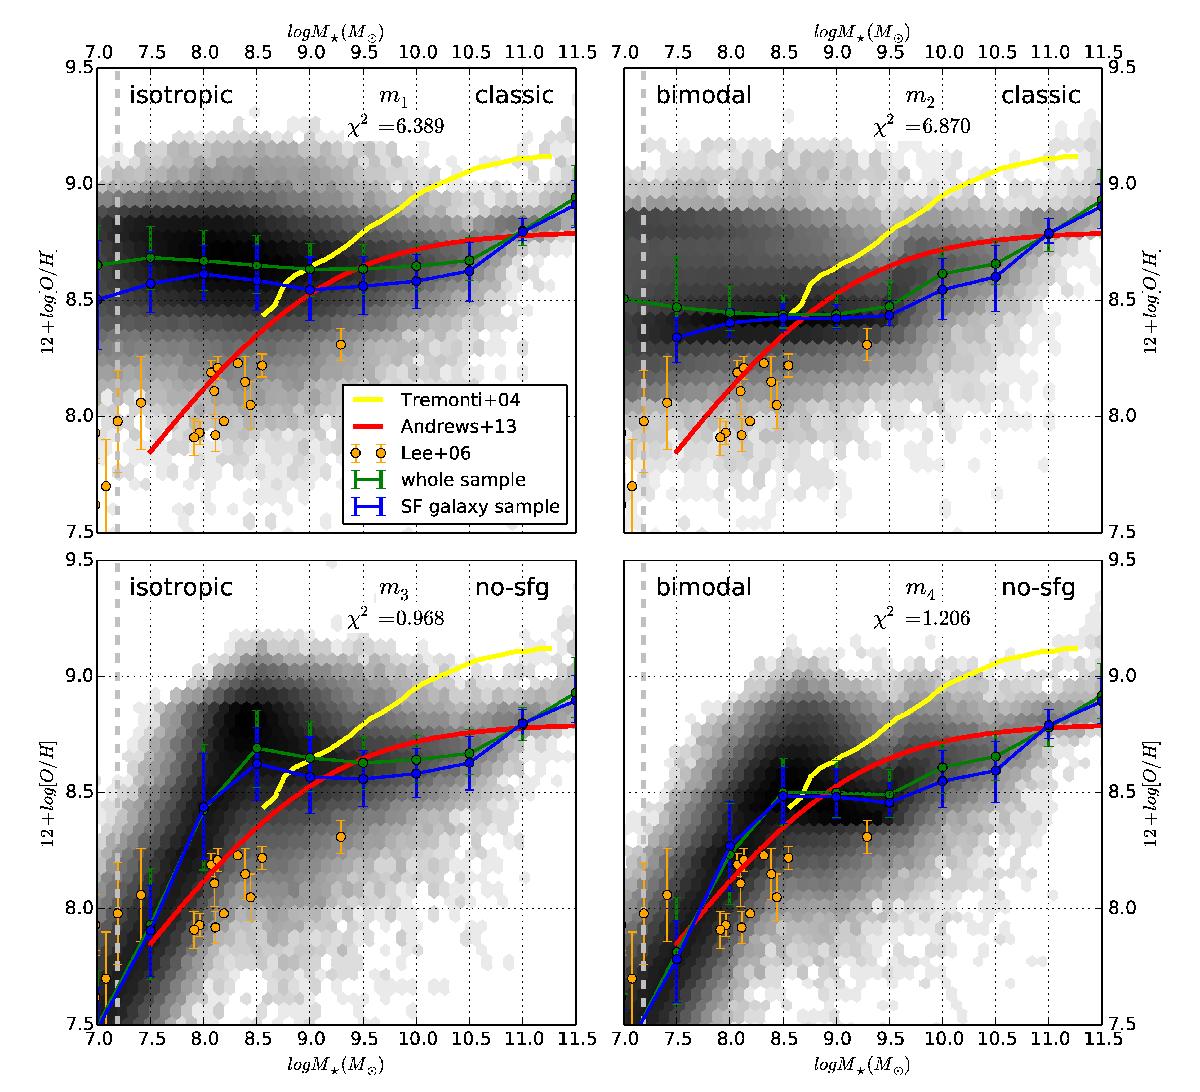
M⋆ − Zg relation. The gas metallicity Zg is given in terms of 12 + log10(O / H); we assume Z⊙ = 8.94 (Karakas 2010). The four distinct panels are distributed as in Fig. 5 (see Table 3 for model references). Same colours and grey scale are used for the distribution of modelled galaxies (all sample, median trend). Our predictions are compared to observational measurements from i) Tremonti et al. (2004): yellow solid line; ii) Andrews & Martini (2013): solid red lines; and iii) Lee et al. (2006): orange points. The grey vertical dotted line represents the stellar mass resolution limit.
Current usage metrics show cumulative count of Article Views (full-text article views including HTML views, PDF and ePub downloads, according to the available data) and Abstracts Views on Vision4Press platform.
Data correspond to usage on the plateform after 2015. The current usage metrics is available 48-96 hours after online publication and is updated daily on week days.
Initial download of the metrics may take a while.