Fig. 5
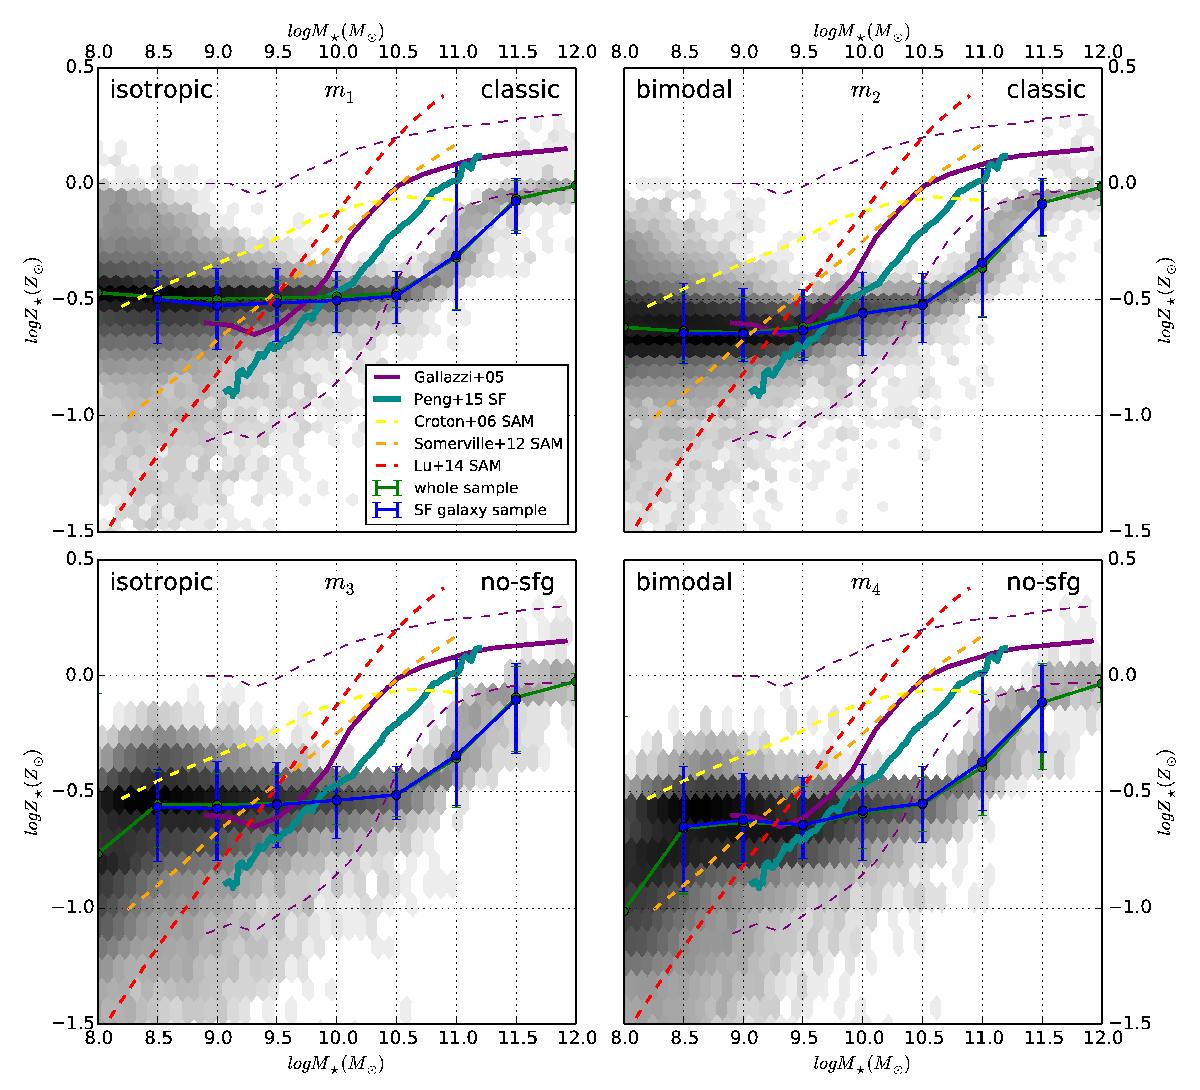
M⋆ − Z⋆ relation. The stellar metallicity in our models is computed using a bolometric luminosity weighting. Four panels correspond to the four different scenarios (model m1 to m4 see Table 3 for model references). In all panels, the grey scales are built with all the galaxies at z = 0.09. The green and blue lines show the median trend of our whole sample and our SF galaxy sample, respectively. Error bars are computed with the first and the third quartile of the distribution. Our models are compared to observations from Gallazzi et al. (2005) (grey lines). We also compare our results to a set of other SAM: Croton et al. (2006) (yellow dashed line) Somerville et al. (2008, 2012) (orange dashed line), and Lu et al. (2011b) (red dashed line). The average relations for the different SAMs were extracted from Lu et al. (2014).
Current usage metrics show cumulative count of Article Views (full-text article views including HTML views, PDF and ePub downloads, according to the available data) and Abstracts Views on Vision4Press platform.
Data correspond to usage on the plateform after 2015. The current usage metrics is available 48-96 hours after online publication and is updated daily on week days.
Initial download of the metrics may take a while.