Fig. 4
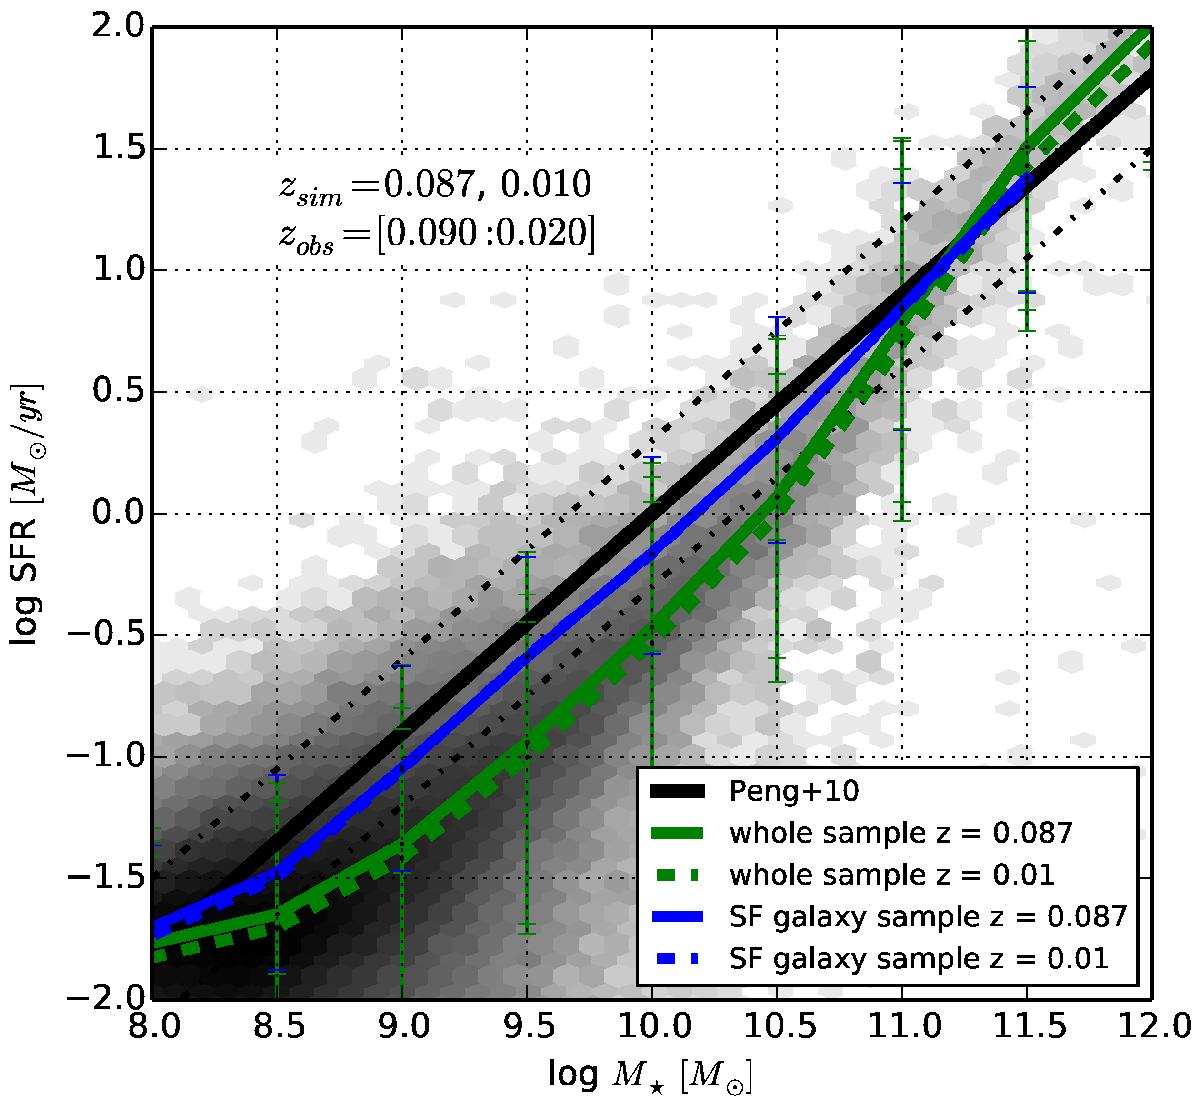
M⋆ – SFR relation at z = 0.01 and z ≃ 0.09. The grey scale histogram materialises the population of the whole galaxy population extracted at z ≃ 0.09 from our model m3. The mean trends of our whole and sub-sample of SF galaxies are shown with green and blue lines, respectively. Solid and dashed lines show the trend at z = 0.01 and z ≃ 0.09, respectively. Error bars are computed following the first and the third quartile of the distribution. These relations are compared to the observational data of Peng et al. (2010): the black solid line shows the mean trend of the main sequence found in the SDSS-zCOSMOS (0.02 <zobs< 0.09) survey. The two dashed lines materialise a scatter of 0.3 around the mean relation.
Current usage metrics show cumulative count of Article Views (full-text article views including HTML views, PDF and ePub downloads, according to the available data) and Abstracts Views on Vision4Press platform.
Data correspond to usage on the plateform after 2015. The current usage metrics is available 48-96 hours after online publication and is updated daily on week days.
Initial download of the metrics may take a while.