Fig. 11
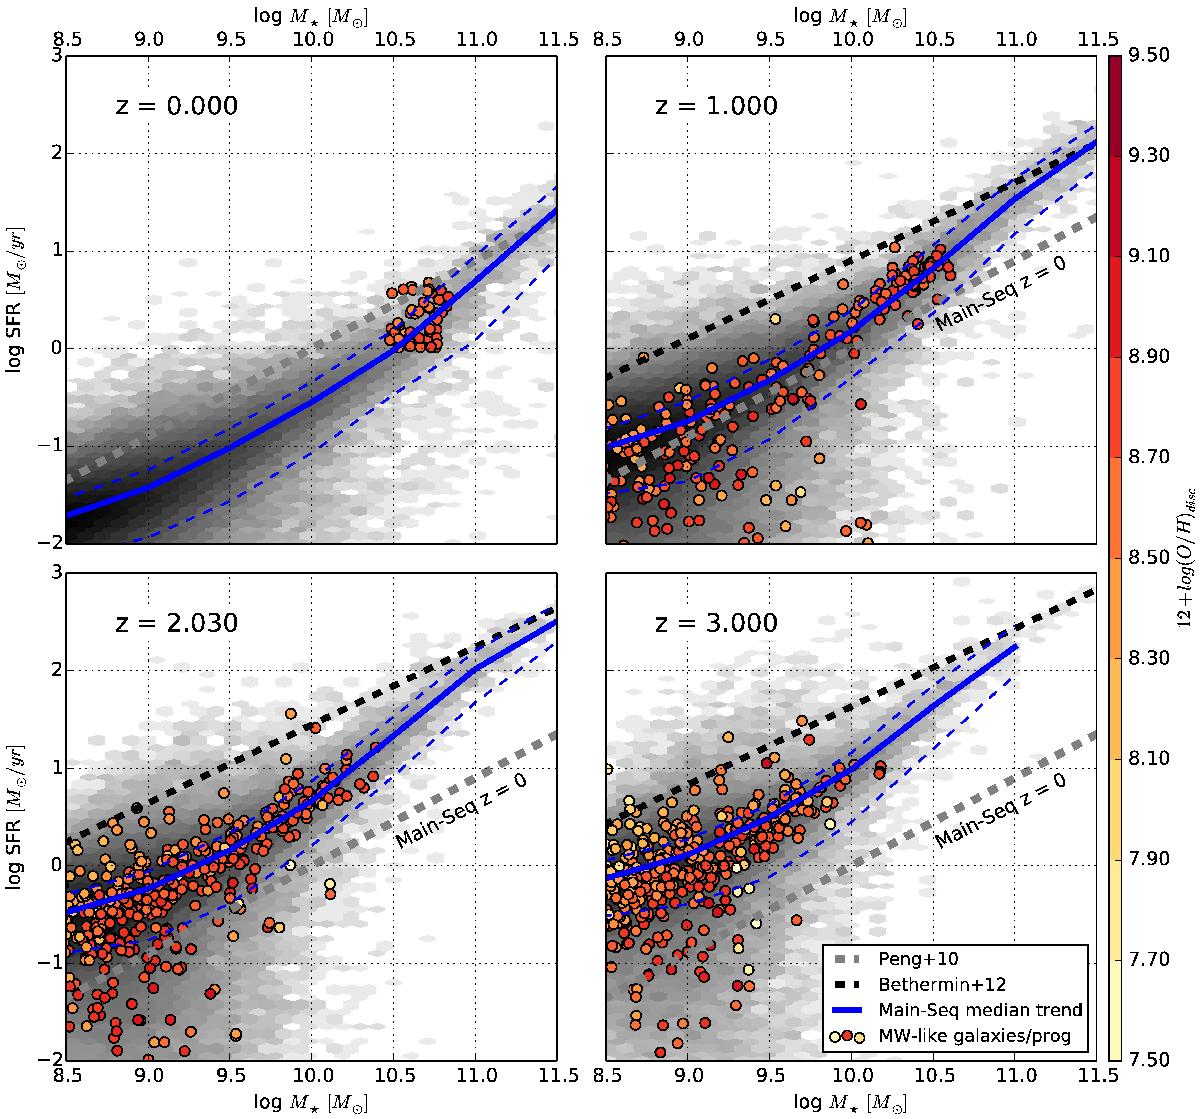
Evolution with redshift of MW-sisters progenitors onto the main sequence. The four panels are dedicated to four different redshift from z = 0. in the top left to z = 3.0 in the bottom right. The grey scale shows the population of all star-forming (SFR> 0) galaxies extracted from our best model m3, the blue solid line is the mean trend found for these galaxies, and the two blue dashed lines show the first and third quartile of the distribution. Circles are MW-sisters galaxies or their progenitors. The oxygen to hydrogen relative abundance in the disk’s gas phase is colour-coded. The grey dashed line represents the main sequence measured by Peng et al. (2010) in the SDSS survey. The dark dashed line is the main sequence of Béthermin et al. (2012) for z> = 1.
Current usage metrics show cumulative count of Article Views (full-text article views including HTML views, PDF and ePub downloads, according to the available data) and Abstracts Views on Vision4Press platform.
Data correspond to usage on the plateform after 2015. The current usage metrics is available 48-96 hours after online publication and is updated daily on week days.
Initial download of the metrics may take a while.