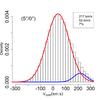
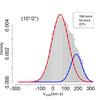
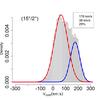
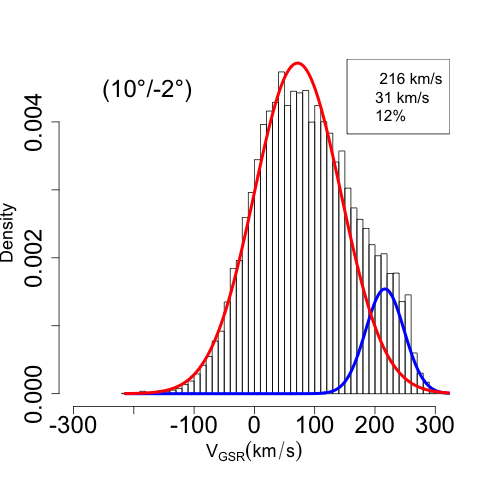
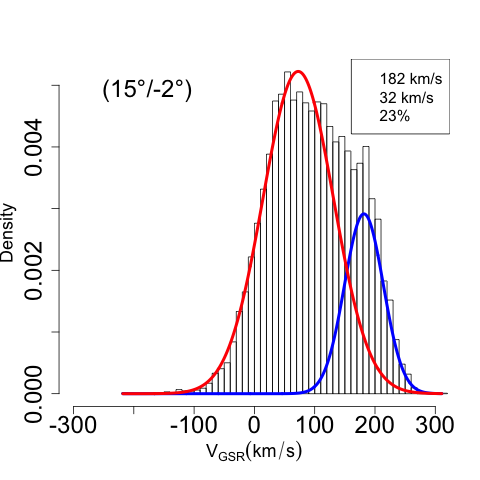
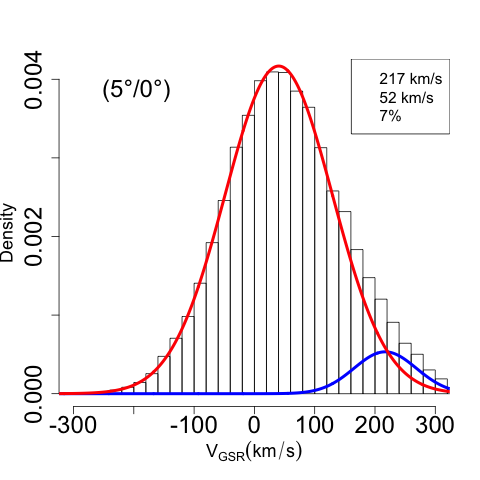
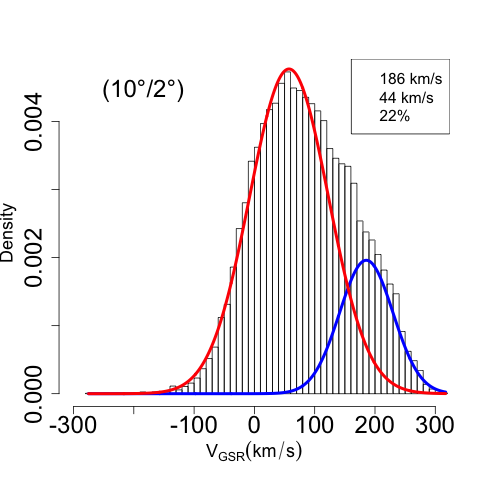
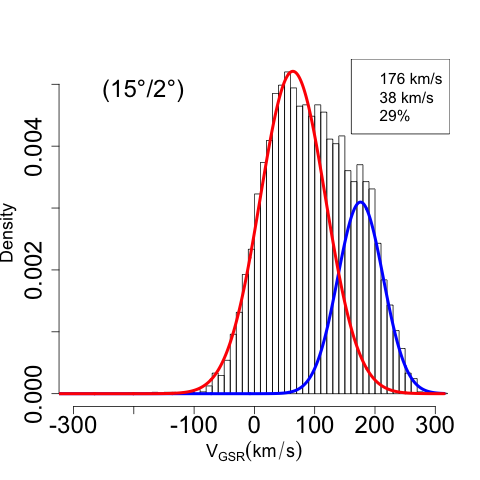
Fig. A.13
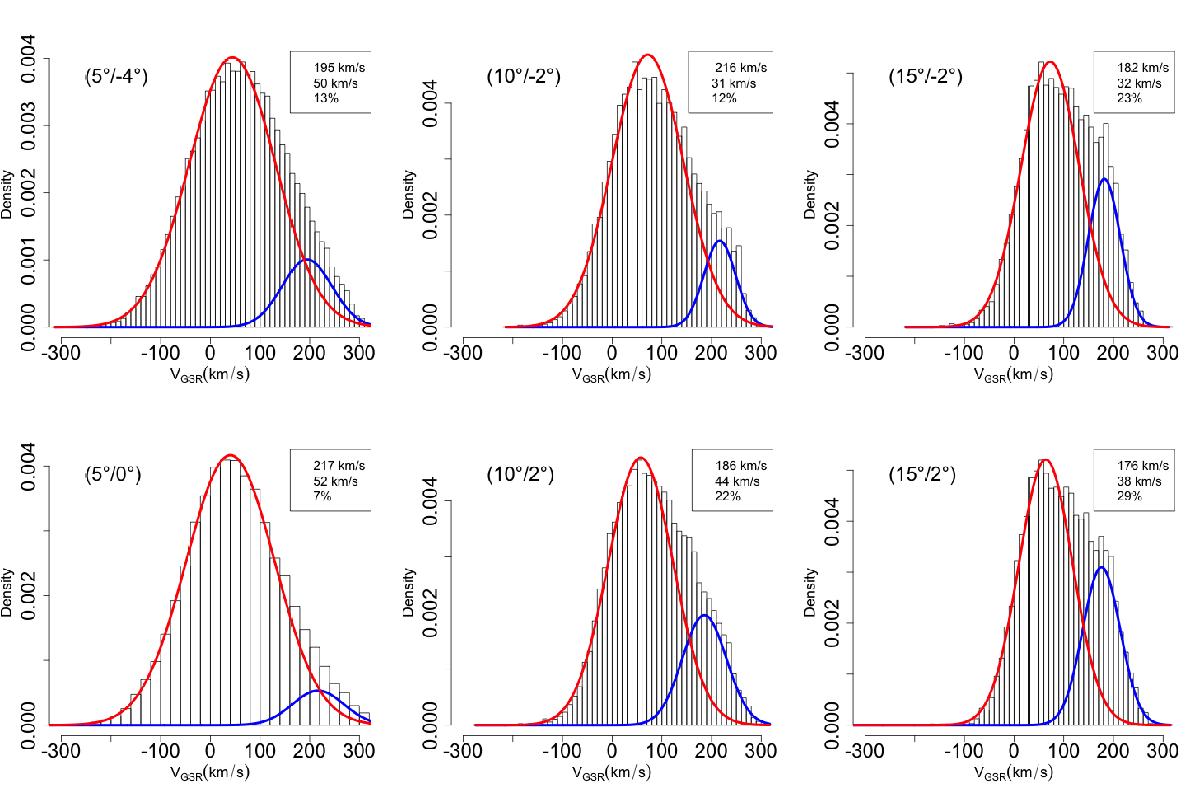
VGSR radial velocity histograms in different fields (l,b) (top left). The size of each field is Δl = Δb = 1° for l< 15° and 1.5° otherwise. All stars along each direction were selected. A two-Gaussian model is fitted to the data. The cold kinematic component is in blue and the corresponding mean value, dispersion, and fraction of stars (in percentage) are given at the top right. The mean errors are smaller than 1 km s-1 for the mean and the dispersion values and smaller than 1% for the fraction of stars.
Current usage metrics show cumulative count of Article Views (full-text article views including HTML views, PDF and ePub downloads, according to the available data) and Abstracts Views on Vision4Press platform.
Data correspond to usage on the plateform after 2015. The current usage metrics is available 48-96 hours after online publication and is updated daily on week days.
Initial download of the metrics may take a while.