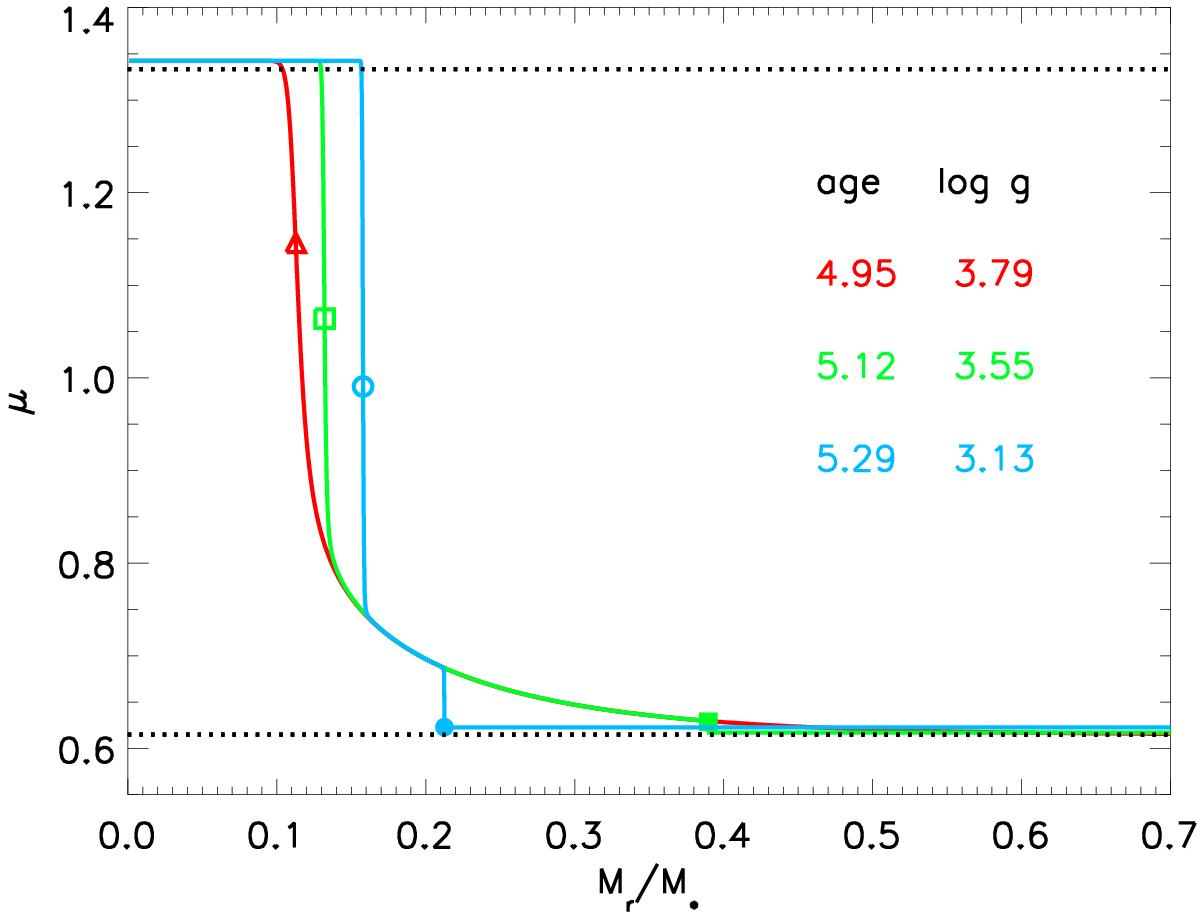
Fig. 6

Mean molecular weight profile as a function of the fractional mass in the interior of 1.25 M⊙ models at three different evolutionary stages (cf. Fig. 1): early post-TAMS (red, diamonds), subgiant (green, squares) and red giant (blue, circles). The approximate formula ![]() , valid for a fully ionized gas, has been used. Ages in Gyr and log g are shown on the side. The filled and open symbols on each curve mark the He core outer boundary and the bottom of the outer convection zone, respectively. Dotted lines indicate the pure helium μ = 4 / 3 and pristine composition μ ≈ 0.6.
, valid for a fully ionized gas, has been used. Ages in Gyr and log g are shown on the side. The filled and open symbols on each curve mark the He core outer boundary and the bottom of the outer convection zone, respectively. Dotted lines indicate the pure helium μ = 4 / 3 and pristine composition μ ≈ 0.6.
Current usage metrics show cumulative count of Article Views (full-text article views including HTML views, PDF and ePub downloads, according to the available data) and Abstracts Views on Vision4Press platform.
Data correspond to usage on the plateform after 2015. The current usage metrics is available 48-96 hours after online publication and is updated daily on week days.
Initial download of the metrics may take a while.


