Fig. 8
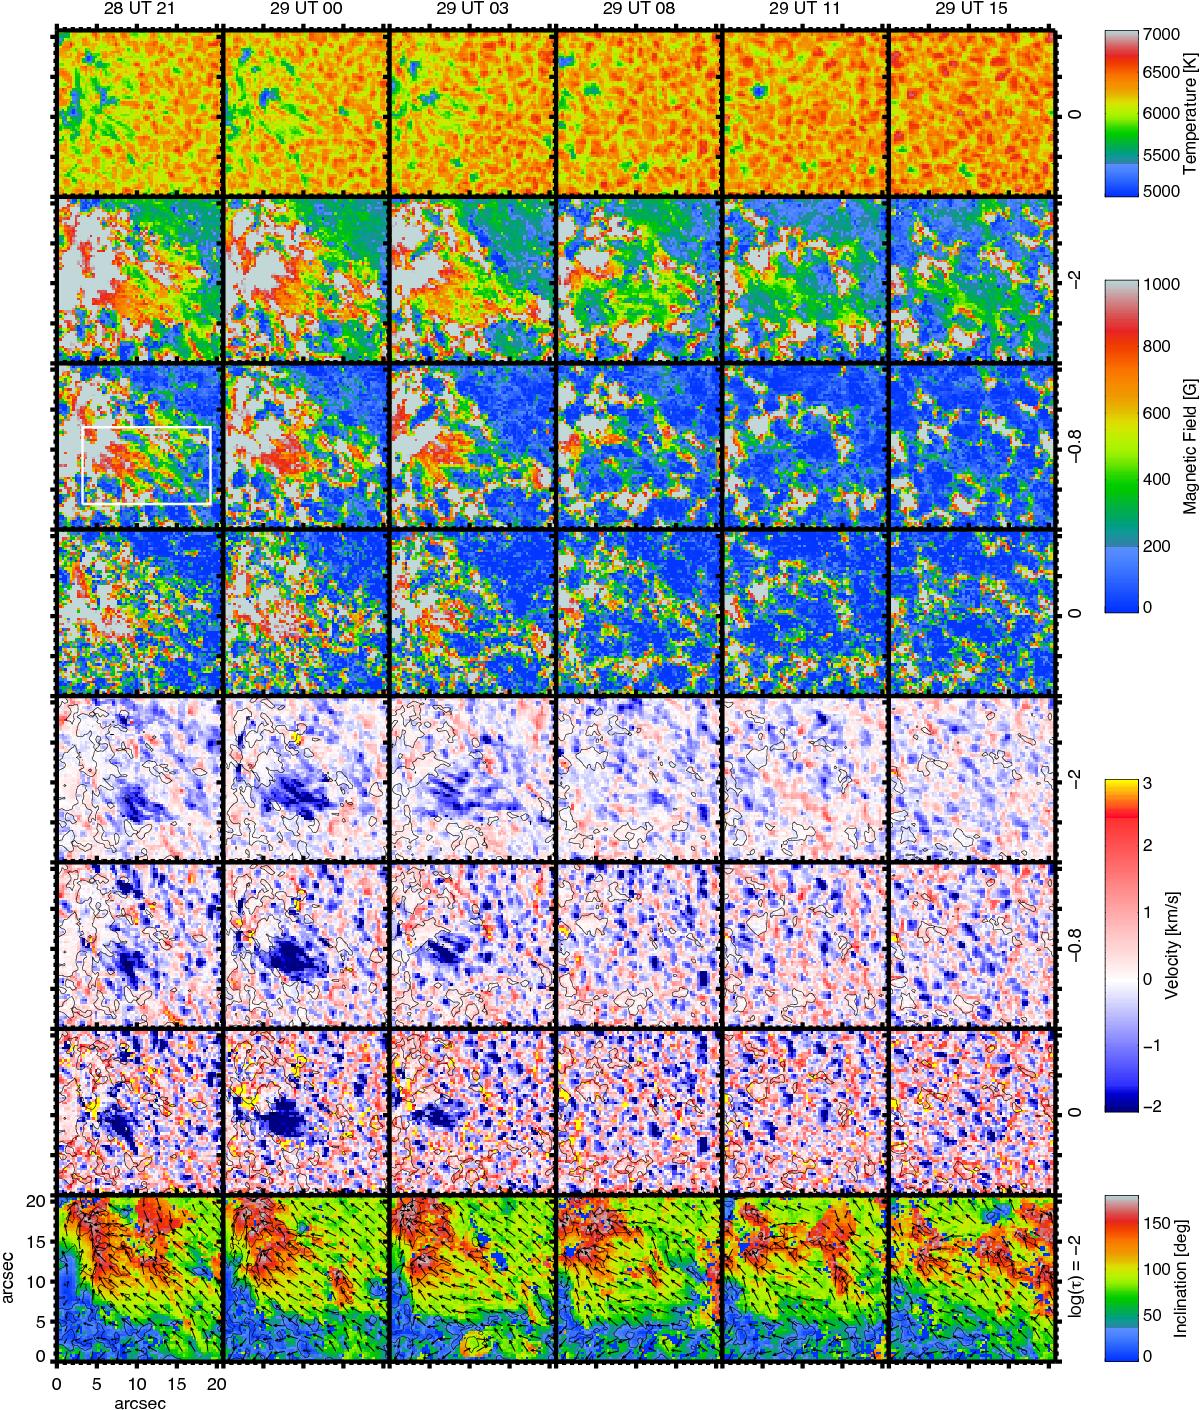
Sequence of inverted SOT/SP scans of region B. The black contour lines enclose kG magnetic fields at log (τ) = −0.8 and the arrows indicate the direction of the azimuthal magnetic field component at log (τ) = −2. The colour bars apply to all plots of their type and the xy axes indicate the size of each plot. The log (τ) layer of each plot is also indicated on the right of each row. The white box encloses rising magnetic fields.
Current usage metrics show cumulative count of Article Views (full-text article views including HTML views, PDF and ePub downloads, according to the available data) and Abstracts Views on Vision4Press platform.
Data correspond to usage on the plateform after 2015. The current usage metrics is available 48-96 hours after online publication and is updated daily on week days.
Initial download of the metrics may take a while.