Fig. 7
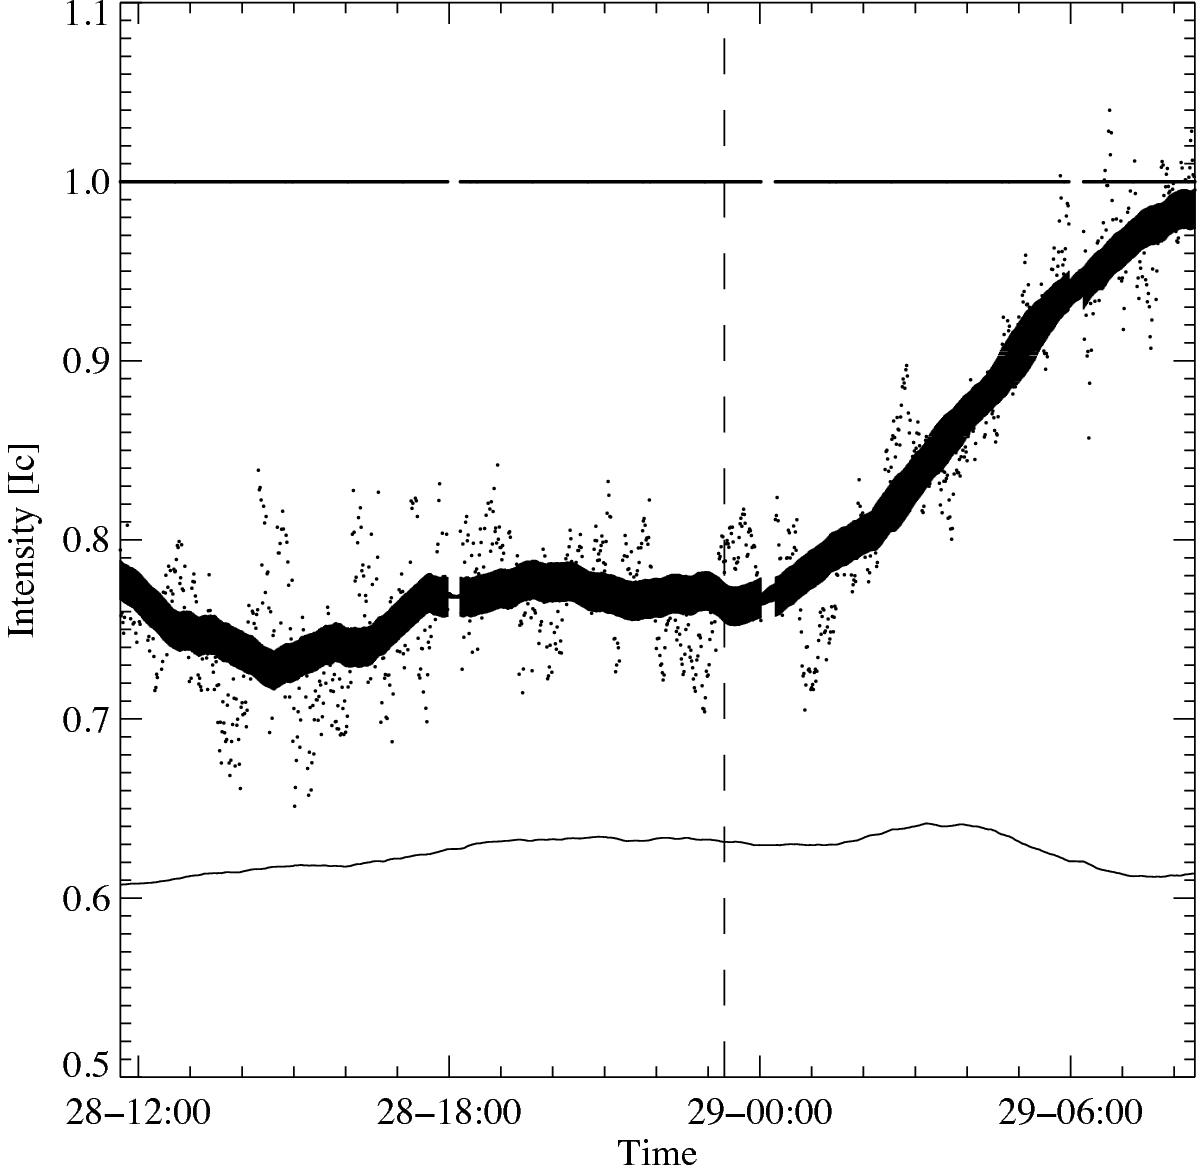
Evolution of the SOT/BFI G-band normalised mean intensity of the orphan penumbrae displayed in Fig. 6. The dots are the individual measurements for each image and the thick solid line represents a 3 h smoothing of these measurements. The continuous thin solid line indicates a 3 h smoothing of normalised mean intensity measurements of sunspot penumbra. The vertical dashed line marks the time of the overlying Hα filament’s disappearance.
Current usage metrics show cumulative count of Article Views (full-text article views including HTML views, PDF and ePub downloads, according to the available data) and Abstracts Views on Vision4Press platform.
Data correspond to usage on the plateform after 2015. The current usage metrics is available 48-96 hours after online publication and is updated daily on week days.
Initial download of the metrics may take a while.