Fig. 4
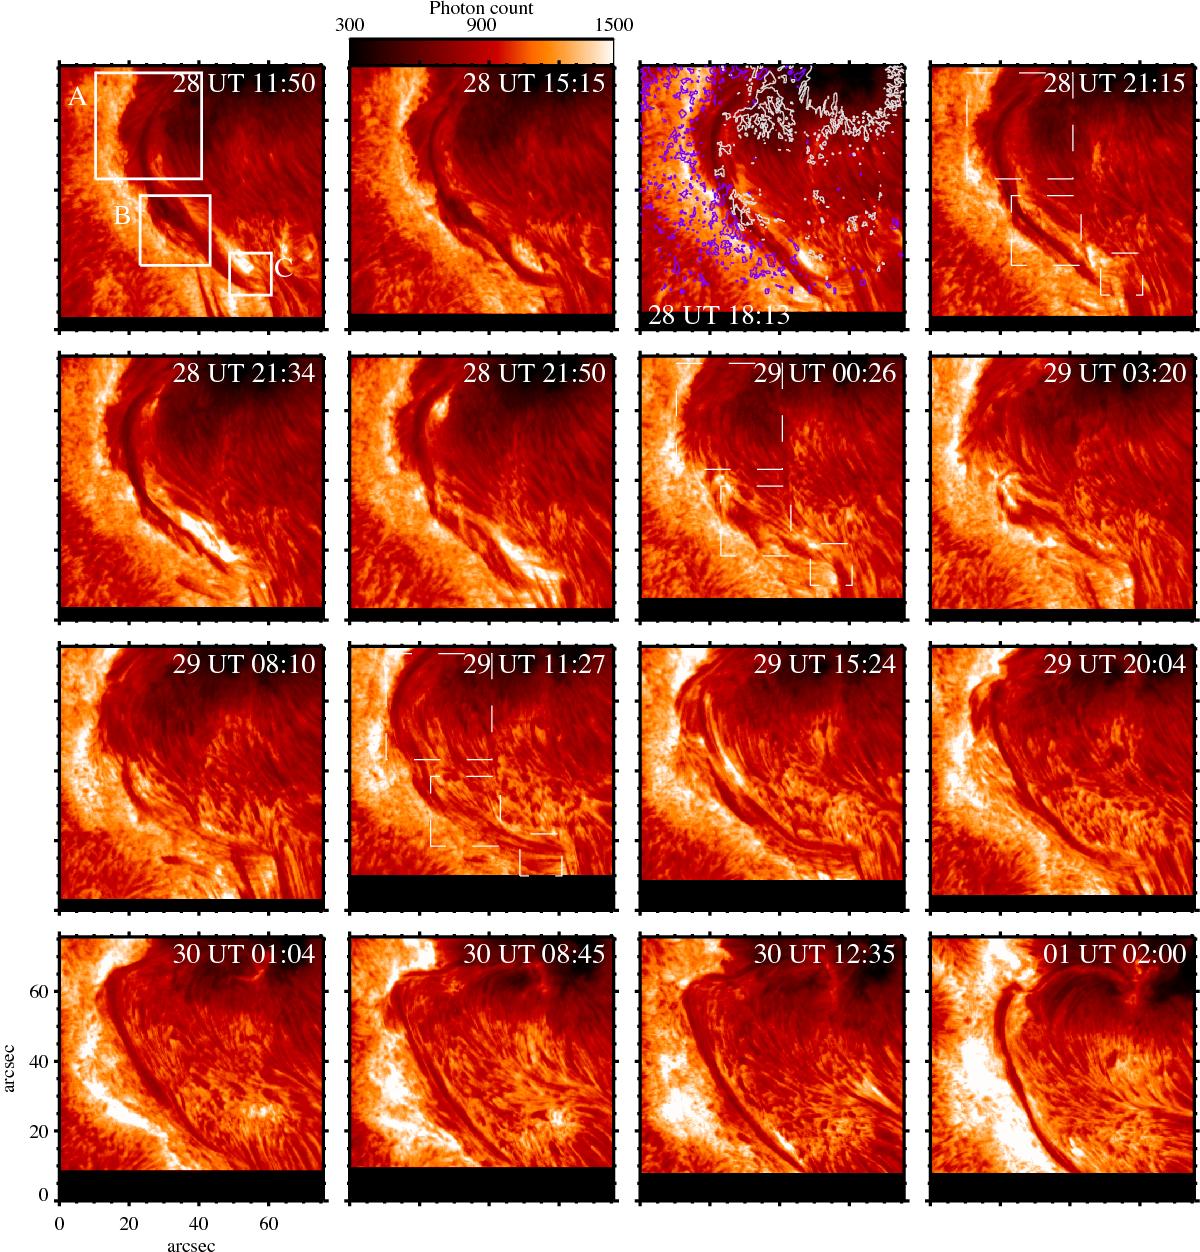
Sequence of SOT/NFI Hα images. The colour bar applies to all plots and the xy axes indicate the size of each image. The contour lines in the 3rd frame of the top row enclose kG magnetic fields at log (τ) = −0.8 obtained from the inversion of a SOT/SP scan. The grey contour lines in the third panel of the top row correspond to negative polarity and the magenta to positive polarity fields. The three white boxes are identical to those in Fig. 1.
Current usage metrics show cumulative count of Article Views (full-text article views including HTML views, PDF and ePub downloads, according to the available data) and Abstracts Views on Vision4Press platform.
Data correspond to usage on the plateform after 2015. The current usage metrics is available 48-96 hours after online publication and is updated daily on week days.
Initial download of the metrics may take a while.